

As distributed and hybrid work become the default operating model in 2026, a new productivity dilemma is emerging for organizations: How can organizations measure remote employee productivity without setting up a system that causes exactly the opposite- a loss of focus, engagement and sustainable performance? Productivity monitoring tools have long relied on visible activity. IT or managers could track logins, browsing, application use, screenshots, and idle time to understand what was happening on distributed endpoints.
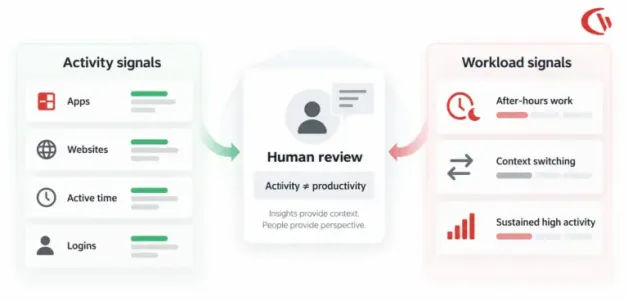
But activity is not the same thing as productivity. The employee may spend a full eight hours juggling between applications and still not get meaningful work done due to meetings, distractions, over-communication, multitasking or lack of prioritization. Alternatively, an employee may be engaged with a computer in a minimal way while doing analysis, planning, research, customer conversations and creative work. This distinction will increasingly matter in 2026.
It is a reminder to HR and IT decision-makers: More digital activity does not equate to greater productive capacity. Benchmarking modern remote workers’ productivity has to shift from activity counts to an employee’s focus, workload, capacity, results, and experience.
What Is the 2026 Remote Workforce Trust Deficit?
The remote workforce trust gap refers to the friction that results when organizations deploy digital monitoring in greater measure than they deploy transparency, purpose and trust into that digital monitoring. Remote work inherently creates a transparency problem. As work moves to homes, coworking spaces, offices, and different time zones, managers cannot observe work in real time with high certainty. That may lead organizations to put in ever more granular monitoring. When used appropriately, workforce analytics can uncover technology chokepoints, workloads, underutilized applications, workflow inefficiencies, security concerns and capacity issues.
The issue arises when you move from monitoring through workforce intelligence to monitoring through individual surveillance. Uninterrupted screen recording, inflexible keystroke counts, whatever artificially imposed activity-hour goals and scoring on digital activity only incentivize employees to work toward the measure, not the goal. A worker leaves programs open and running just to look busy. Another doesn’t take a break because inactivity can be used against her. Still another logs hours of evening work to support the perception that the organization undesirably incentivizes outputs, not outcomes.
How monitoring can backfire Gartner research cited by IT Brew shows the impact of employee monitoring. Employees who felt overly watched were up to 24% less likely to stay with their employer. Employees who experienced consequences from monitoring were 7% less engaged in the workplace.
This does not necessarily imply that monitoring employees at work will lead to a disengaged workforce or high turnover. Monitoring methods vary widely, and many factors influence engagement.
How to Distinguish Activity Signals from Burnout Risk
One of the most important elements of 2026 workforce benchmarking is learning to distinguish activity signals from burnout indicators. Activity signals are measurable behaviors.
They include:
- Application activity
- Website usage
- Active computer time
- Idle periods
- Login and logout activity
- Meeting participation
- Messaging activity
- After-hours computer use


They include:
- Application activity
- Website usage
- Active computer time
- Idle periods
- Login and logout activity
- Meeting participation
- Messaging activity
- After-hours computer use
While these signals can offer useful information, none should substitute for deliberately and objectively considering whether an employee is in a state of productivity or burnout. What works much better is looking for patterns in many signals. For instance, non-work time in the evenings could be normal for an employee who is working with colleagues across multiple time zones.
However, “9 hours of work a day with an increase in the total hours, and decrease in what they output” could indicate an employee at capacity. In the same way, “being offline occasionally for coffee breaks or something of that sort doesn’t necessarily mean that the worker is not engaged. It could be that they are on a call, in an offline meeting, reading documents, or other work that doesn’t require interaction.”
In 2026, Ayokunmi Sodamola studied whether predictive analytics could be used to improve diagnosis and balance productivity and burnout risk in technologically advanced workplaces. The investigation used complex real-world data from observations of work patterns among 1,800 people and built a predictive analytics model grounded in well-documented theories such as the Job Demands-Resources model, Conservation of Resources theory, and the Effort-Recovery Model. This article is relevant to workforce analytics because it shows how actual work patterns can identify risk.
Step-by-Step Guide to Implementing Privacy-First Productivity Tracking
Not all productivity tracking needs to focus on every mouse movement, keystroke, and second that an employee spends in front of their screen. Going for a privacy-first approach is a matter of asking a different question: What data does the organization truly require in order to optimize workflow, safeguard systems, and gain insight into their workforce’s bandwidth? For companies building a Remote Employee Productivity Benchmarking 2026, the goal should be to gather valuable activity signals, not to monitor employees excessively. Here is how:

Step 1: Define the Business Purpose Before Collecting Data
Be clear on the precise purpose for capturing the productivity information. Typical justification for such activities may be to assess how applications are being used, to pinpoint the bottlenecks in the workflow, to measure resource utilization or network traffic or to gauge workplace utilization. Don’t have vague goals such as “monitor employees” or “drive increased activity”. A solid, defined purpose helps you know what information you need and what you don’t.
For example:
- Purpose: Identify inefficient software workflows.
- Useful data: Application usage and utilization patterns.
- Unnecessary data: Individual keystroke recordings.
- Action: Review whether frequently used applications slow workflows or create unnecessary context switching.
Step 2: Decide What You Actually Need to Measure
Not every available monitoring metric belongs in a productivity program. Create a measurement framework that separates useful activity signals from intrusive surveillance indicators.
Useful signals can include:
- Application and website usage
- Active versus inactive periods
- Login and logout patterns
- Workstation or location utilization
- Bandwidth consumption
- File-transfer activity where security requires it
- Team-level workload trends
- Software utilization and adoption
- Meeting and collaboration patterns
Step 3: Establish Clear Employee Privacy Boundaries
Before deployment, establish boundaries around what can be monitored, when monitoring occurs, and who can access the information.
A privacy-first policy should clearly address:
- What information is collected
- Why it is collected
- When monitoring operates
- Which devices or applications are covered
- Who can access the data
- How long information is retained
- How employees can raise questions or concerns
- Whether monitoring differs between company-owned and personal devices
Step 4: Prefer Aggregated and Team-Level Insights
When benchmarking productivity, team-level trends may be more helpful than individual surveillance scores. For instance, in the case that a department exhibits an abnormal level of application use and longer-than-average working hours, managers can look into whether the team is:
- Excessive workloads
- Inefficient processes
- Staffing shortages
- Too many meetings
- Poorly optimized applications
- Repetitive manual tasks
- Unclear responsibilities
Step 5: Separate Productivity Data From Performance Judgments
One key control is not to treat activity as a full indicator of employee productivity. An individual might spend hours researching, thinking, reviewing documentation, attending meetings and solving a difficult problem without leaving the same digital trail as someone performing repetitive tasks. For this reason, productivity benchmarking will use a combination of activity signals and outcome-based indicators such as:
- Completed projects
- Quality of deliverables
- Customer-service outcomes
- Deadlines achieved
- Error rates
- Team objectives
- Business results
Step 6: Establish Burnout-Risk Indicators
A privacy-first monitoring strategy should not attempt to diagnose burnout from computer activity. Instead, organizations can use workforce data to identify patterns that warrant a human conversation.
Potential organizational warning signals include:
- Repeatedly extended working hours
- Increasing after-hours activity
- Persistent workload concentration within a team
- Large increases in meeting or collaboration time
- Sustained periods of unusually high activity
- Frequent switching between applications
- Significant changes in normal work patterns
Step 7: Configure Data Minimization and Retention
Once you have identified the appropriate measures, decide how much data to keep and for how long. No organization should start collecting employee activity data indefinitely just because data storage is inexpensive. Instead, set retention periods for employee activity data based on legal, regulatory, or legitimate business needs.
Consider:
- Collecting only required fields
- Limiting historical data where possible
- Restricting access to sensitive information
- Deleting information when it is no longer needed
- Using aggregated reporting where individual-level information is unnecessary
Recent Workforce Benchmarks Summary Matrix
The table below may serve as a reference section for a workforce productivity, employee analytics, remote-work, and employee-monitoring article.
| Workforce Benchmark | Findings | What it Indicates |
|---|---|---|
| Global employee engagement | 20% of employees were engaged globally in 2025 | Only a minority of employees are highly psychologically engaged with their work. |
| Global disengagement | 64% not engaged; 16% actively disengaged | Engagement metrics should be considered alongside disengagement rather than productivity signals alone. |
| Economic impact of low engagement | About $10 trillion in estimated lost productivity | Gallup connects employee engagement with organizational and economic productivity. |
| U.S. hybrid work | 52% of U.S. employees with remote-capable jobs work hybrid | Hybrid work remains a major operating model rather than a temporary arrangement. |
| U.S. exclusively remote | 26% of remote-capable employees work exclusively remotely | A substantial portion of the remote-capable workforce remains fully distributed. |
| U.S. on-site, remote-capable | 22% | Workforce-location data should distinguish remote-capable employees from jobs that cannot be performed remotely. |
Creating a Sustainable Digital Workplace
Companies benchmarking remote employee productivity need to reconsider what that means. Just because someone appears busy or active on their device doesn’t mean they are actually productive, and if your dispersed team is busy at all hours, that could signal a stressed employee experiencing burnout. Benchmark the right metrics.
Best practices for managing a remote workforce should include activity metrics and high-level metrics like application use, work habits, collaboration needs, deep work periods, and work volume. Productivity monitoring tools that are not obtrusive, like CurrentWare Location Insights, allow your organization insight into workplace attendance and utilization rates without allowing a few keystrokes, mouse movements, and screen captures to be your new definition of productivity.
The most useful measures let managers detect trends rather than monitor people. For instance, if someone regularly shows abnormally long active hours, it could prompt a discussion about workload rather than claims about productivity. Also, switching between applications frequently, working extra hours, or an overly active meeting schedule are appropriate behavior indicators for workflow issues.
Ultimately, Remote Employee Productivity Benchmarking in 2026 must focus on sustainable productivity, not digital overload. The most effective workforce practices optimize transparency and control, but also empower employees with the data to understand how they work, rather than how much time they are on the screen. With productivity benchmarks, exposure to workload, and signals of burnout risk, enterprises can craft a digital workplace that optimizes for both performance and wellbeing.


