
CurrentWare ROI Calculator
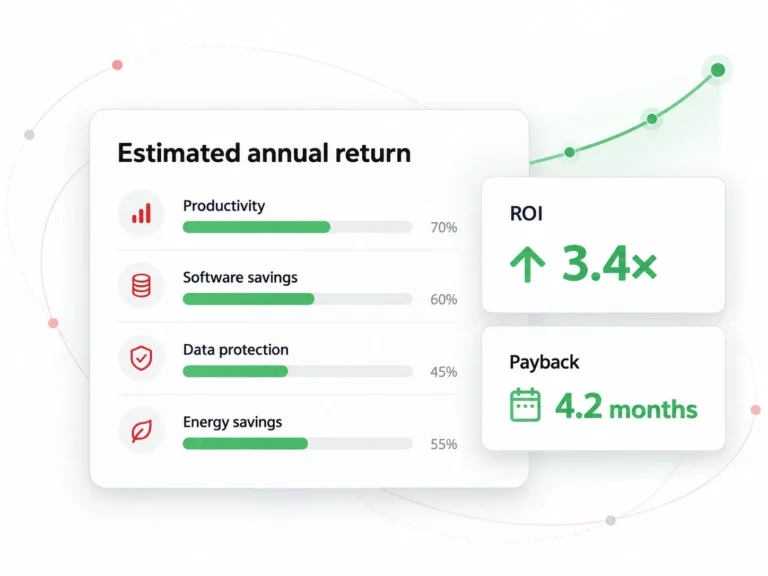
Use this ROI calculator to estimate what CurrentWare could return in a year, including savings from four areas:
- recovered employee productivity
- unused software licenses you can cut
- data loss prevention, including the potential cost of a breach
- lower energy use from idle computers
In just a few inputs, you will see your total gain or loss, ROI percentage and payback period.
Figures in
Employee productivity
BrowseReporterEstimated productivity gain: %
Based on gold standard research benchmarks. See the research and how we calculate savings ↓ See the research and how we calculate savings ↓
Software cost savings
BrowseReporterLicenses going unused: %
Based on Gartner’s research benchmarks See the research and how we calculate savings ↓
Data loss prevention
AccessPatrol and BrowseControlTypical breach cost, mid-sized company: $3.3M
It varies enormously by size and sector, and stolen intellectual property may not have a price at all. Where this figure comes from ↓
Device power management
enPowerManager
Want the real number?
A calculator cannot see your tooling, your headcount mix or your renewal dates. A 20-minute call can, including when the answer is that CurrentWare is not the right fit.
- Your figures from this page arrive with the request
- A volume-discounted quote for your actual license count
- A walkthrough on real software usage data, not benchmarks
- Cloud, self-managed cloud or on-premises
Questions about the numbers
Every default, every source, and the maths behind each figure.
-
It estimates what CurrentWare is worth to you in a year across four areas: productivity recovered across the team, unused software licenses you can cancel, data loss incidents avoided, and electricity saved by powering devices down. It then subtracts what CurrentWare costs at list price, so what you see is a net figure, not a gross one.
-
It is simply an estimate, not a measurement. The calculator uses published gold standard benchmarks for its defaults, and we’ve kept those numbers conservative. The more of your own data you enter, the more relevant the estimate becomes.
Assumption We use Published research Annual cost per employee $52,000 $97,000 US private-industry average Productivity gain 7% 7.1% measured Share converted to cash 25% No published figure Staff in computer-based roles 80% Varies by organization Unused software licenses 25% At least 25% Cancellable at renewal 50% No published figure Software spend per employee $9,455 fallback $9,455 median Volume discount applied None Available from 100 licenses -
A 2024 peer-reviewed field study in Management Science by Ko and Baek measured a 7.1% productivity increase after an organization introduced computer monitoring for telecommuting staff. It is observed output, not a survey estimate. The same study found the gain was larger for previously low-performing employees, and noted a higher departure rate when monitoring is rolled out without clear communication. Read the study.
-
The simple answer is that more productive time doesn’t automatically mean more money. The time you save only becomes a financial return if it helps you avoid a new hire, reduce overtime, or get more billable work done. We use 25% as the starting point for how much of that recovered capacity turns into a measurable financial benefit. The full productivity gain is shown separately, so it isn’t counted twice in the ROI calculation.
-
Not everyone on your payroll can turn recovered time into measurable output. The 80% is an assumption of your team that works primarily in computer-based roles. If you have a large number, you can lower this figure to better match your workforce. Here’s an example of how the calculator gets the estimated return:
For example, with 100 employees, an average salary of $60,000, and a 10% productivity gain:
100 × $60,000 × 10% × 80% × 25% = $120,000 estimated annual productivity savings
-
Gartner’s 2026 Magic Quadrant for SaaS Management Platforms states that through 2028, organizations without centralised visibility into their SaaS portfolio will overspend by at least 25% on software, driven by unused entitlements and overlapping tools. That is exactly the position of a company not yet tracking usage, so 25% is the starting point rather than a ceiling.
-
Leave the field blank and we estimate it as your headcount multiplied by $9,455, the median annual SaaS spend per employee from Zylo’s 2026 SaaS Management Index. Your own figure is almost always more accurate, and this single input drives the whole license saving, so it is the first one worth finding. Zylo SaaS Management Index.
-
We start from a benchmark and then cut it down hard. The $3.3 million default is what IBM measured for organizations under 1,000 employees in its last breakdown by company size. Costs vary enormously, so treat it as a starting point and replace it with a figure from your risk register or your insurer. From there it is expected value, not headline value: the incident cost, multiplied by a 10% chance of it happening in a given year, multiplied by the 25% share we credit to device control and web filtering rather than to your other defences. A full breach cost is never counted as an annual saving. One thing no benchmark covers: if what walks out of the door is your intellectual property, the loss is not a number on an invoice and you do not get it back.
-
The field is pre-filled with the benchmark, but the component stays off until you switch it on, so nothing you did not agree to is in your headline number. It is the lever most likely to be waved away in a budget meeting and the one that matters most if it ever pays out. Check the figure against your own exposure, then turn it on.
-
Devices multiplied by the watts avoided, divided by 1,000, multiplied by 4,000 non-working hours a year, multiplied by your electricity price. We assume a desktop draws about 60 W left on and about 3 W in managed sleep, per ENERGY STAR, so 57 W avoided. It is the smallest number on the page and the easiest for a facilities team to verify. ENERGY STAR.
-
The CurrentWare Suite is $20 USD per user per month, billed annually, and includes all four modules. The minimum annual contract value is $1,440 USD. Volume discounts start at 100 licenses, and education and non-profit organizations may qualify for a discount. See pricing.
-
No. It uses public list pricing, so the cost shown is the most you would ever pay. Discounts begin at 100 licenses, which means the return shown is understated for most teams above that threshold. Ask for a quote to see your real number.
-
annual cost = max(licenses × $20 × 12, $1,440)
productivity = licenses × computer-based % × cost per employee × gain % × realization %
software = annual software spend × unused % × cancellable %
data loss = incident cost × annual probability % × attributable %
energy = licenses × 57 W ÷ 1,000 × 4,000 idle hours × price per kWh
total value = the components you leave switched on
net benefit = total value − annual cost
return = total value ÷ annual cost
payback (mo) = 12 × annual cost ÷ total valueDevices in the energy line follow your license count. If you run fewer machines than licenses, adjust the hours to compensate or ask us for a tailored figure.
-
Yes. Copy link gives you a URL that carries every figure you entered, so anyone opening it sees exactly what you saw. Print to PDF produces a clean one-page summary for a budget pack. Nothing is emailed and no sign-up is required.
Sources: Ko and Baek, Management Science 71(1), 2024 · Gartner Magic Quadrant for SaaS Management Platforms, 2026 · Zylo SaaS Management Index, 2026 · US Bureau of Labor Statistics, March 2026 · ENERGY STAR and US EIA · CurrentWare pricing, August 2026
Keep going
Turn the estimate into a plan.
Software license optimization
The reports behind component two: find paid tools nobody opens before the renewal lands.
SolutionEmployee productivity tracking
Active versus idle time, productivity classification and scheduled reporting.
SolutionData loss prevention
Device control, transfer blocking and the alerts behind component three.
ProductBrowseReporter
The module that produces the data behind the first two components.
ProductenPowerManager
Power schedules, wake-on-LAN and logon tracking.
ProductPlans and pricing
Suite pricing, volume discounts, minimum contract and payment options.
EvidenceCustomer case studies
What other IT teams measured after deploying, including software cost reductions.
ComparisonCurrentWare vs alternatives
Side by side against ActivTrak, Teramind, Insightful and others.
TemplatesPolicy template library
Free, editable workplace policy templates covering internet, monitoring and removable media.
Two weeks of your own data beats any calculator
Deploy on up to 10 computers, free. No credit card.