The AI Usage Dashboard for Adoption, Shadow AI, and Utilization
Monitor AI tool usage, spot unapproved apps, and understand usage trends without ever accessing what employees type into them.
- See which AI tools your employees are actually using.
- Discover which unapproved AI tools show up in productive time.
- Track how usage changes month on month and identify tools outside your approved list.
No credit card required · Deploys in under 15 minutes · Cloud or on-premises suite







AI is already in use; you just need to know how.
Your leadership wants to know whether AI spend is producing anything. Security and compliance want to know whether regulated data is going into tools nobody vetted. To answer both, you need- reliable usage data, segmented by team, over time.
Without it, you run into four problems:
- AI usage is scattered across apps and websites, making it hard to see the full picture.
- Comparing AI adoption across users, teams, and time periods often means manual spreadsheet work.
- Team changes can disrupt historical group data, making long-term trends harder to trust.
Questions this page answers
- What share of our workforce uses AI at all?
- Which AI tools have real traction, and which were tried once?
- Which departments are ahead, and which need enablement?
- Where is unapproved AI usage concentrated?
- Is AI adoption showing up in utilization, or not yet?
- Can I hand a defensible report to the exec team monthly?
One dashboard, four connected views
Every view uses the same timeframe filter, so switching between them keeps your analysis window intact. Each view also has a dedicated empty state when there’s no AI activity during the selected period.
1. Overview
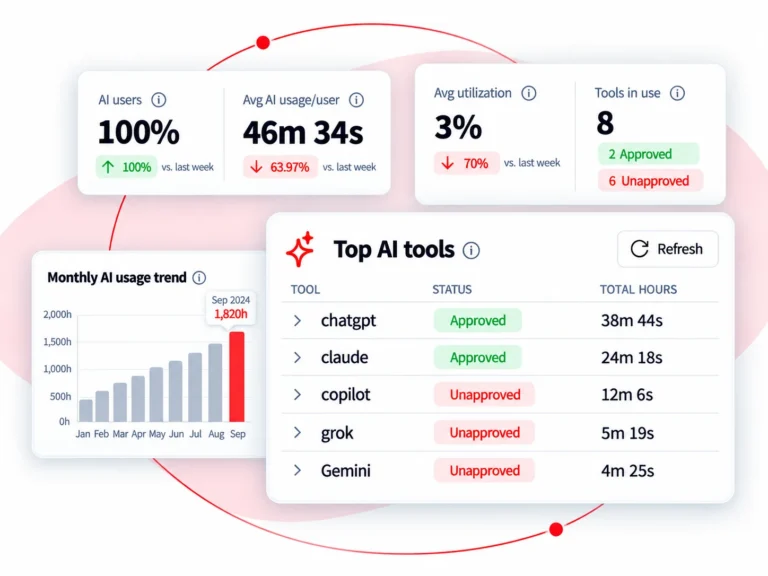
See users analyzed, the share of employees using AI, average usage per active AI user, average utilization, and the number of AI tools in use, each compared with the equivalent previous period.
2. User Breakdown
Drill down to individual users with name search, pagination, sortable columns, and a clear view of whether activity came from an application or the web.
3. Team Breakdown
View AI usage by department in a heat map that switches between usage and utilization rate. Expand any group to see the individual activity behind the numbers.
4. Authorized AI Tool
Define approved AI applications and websites at the organization level or by group when different teams have different approved toolsets.
Find shadow AI before an auditor does
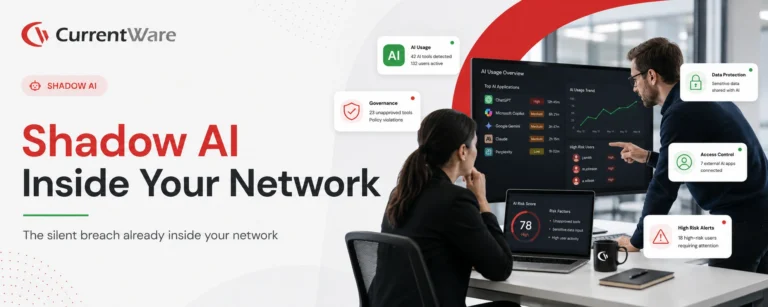
Shadow AI is rarely malicious. Someone has a deadline, the sanctioned tool isn’t provisioned yet, and a free personal account fills the gap. The governance problem isn’t intent – it’s that the activity is invisible, which means data-handling risk sits outside every control you’ve documented.
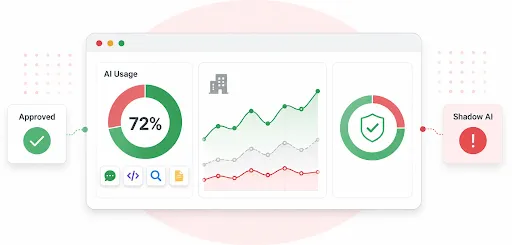
Once your approved AI tools are defined, the dashboard reports your AI landscape in two buckets:
- Approved tools – measure adoption, depth of use, and which teams are behind.
- Unapproved tools – see the tool, the volume, the teams, and the specific users.
The response is a judgement call, not an automatic penalty. Heavy unapproved usage in one department usually means the approved alternative is missing, poorly onboarded, or not licensed widely enough.
From discovery to decision
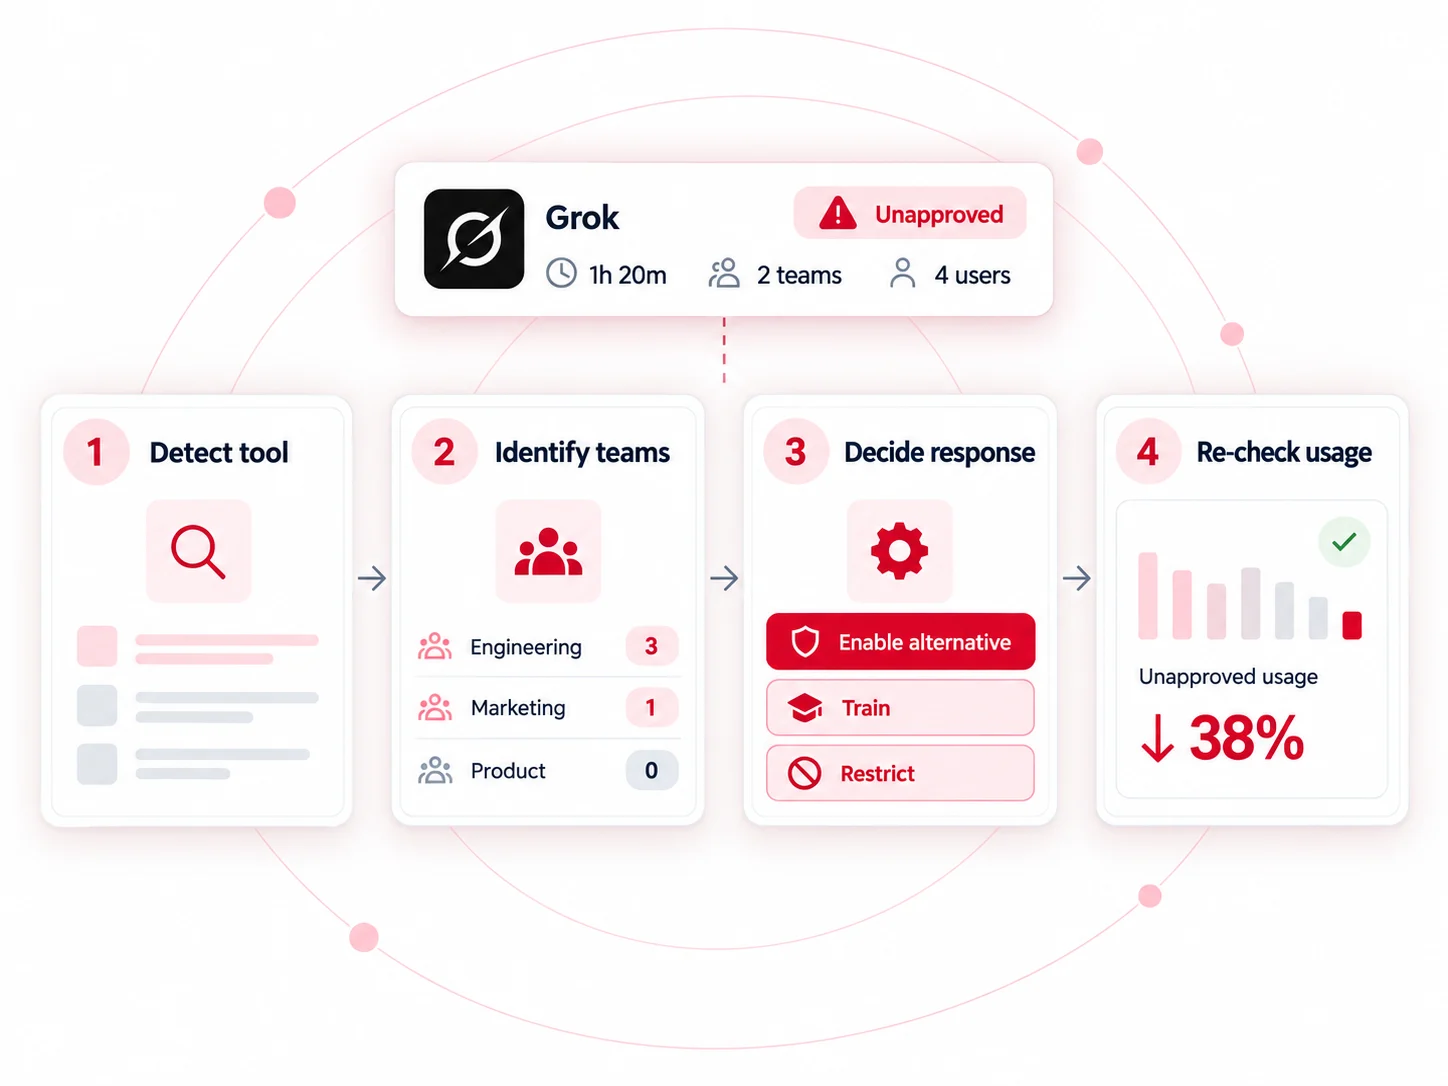
- Spot the unapproved tool and its volume.
- Identify which teams and users drive it.
- Decide: enable an approved alternative, train, or restrict.
- Restrict in BrowseControl when that’s the call.
- Control data movement with AccessPatrol.
- Re-check the dashboard next period to confirm the shift.
Related: shadow AI prevention and preventing AI data leaks.
Compare AI adoption across departments
Organization-wide averages hide the interesting part. Adoption is almost never uniform – one team runs on AI daily while another has never opened it.
| Department heat map | Expand any group | Reorg-safe reporting |
|---|---|---|
| A visual comparison of AI usage by department, with a toggle to view the same groups by utilization rate instead. | Open a department to see individual AI usage behind the aggregate, so a single power user never gets mistaken for a whole team. | Group analysis handles organizational changes when a user or PC moves, so historical team reporting stays interpretable. |
Define your approved AI toolset
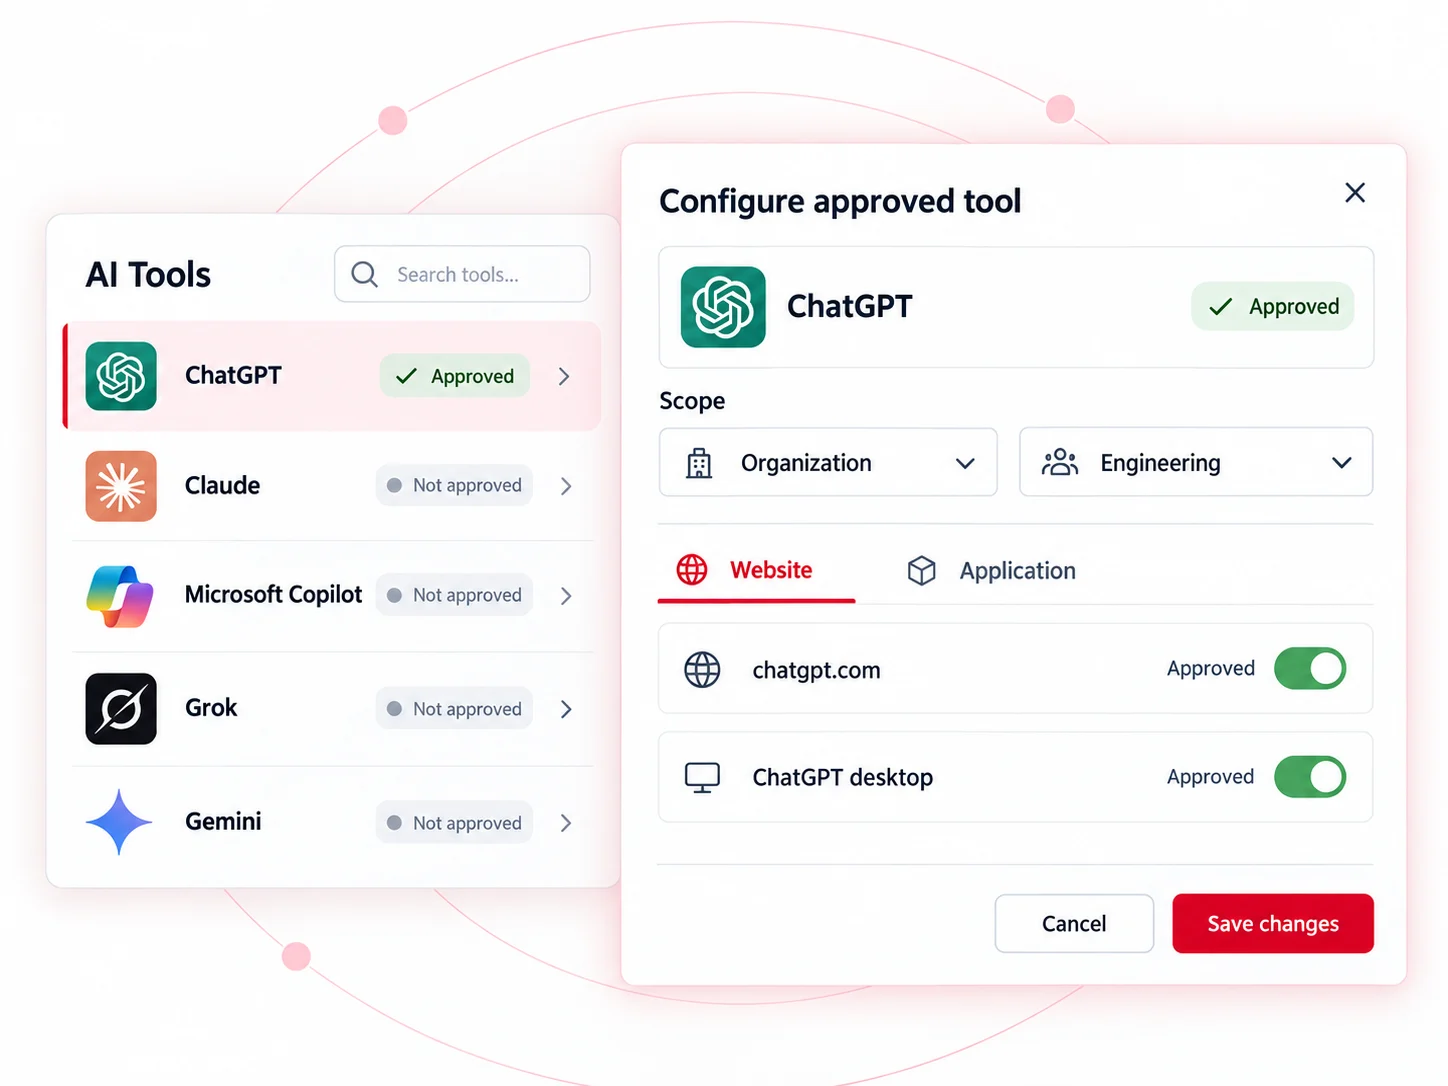
The Authorized AI Tool view is where governance becomes measurable. Administrators list the AI applications and websites the organization approves – globally, or per group when engineering, marketing, and finance are sanctioned for different tools.
Everything reported afterwards is framed against that list, which is what turns an activity log into a governance artefact you can show an auditor.
Configure at: organization level, or group level for teams with different sanctioned stacks.
Pair it with a written policy
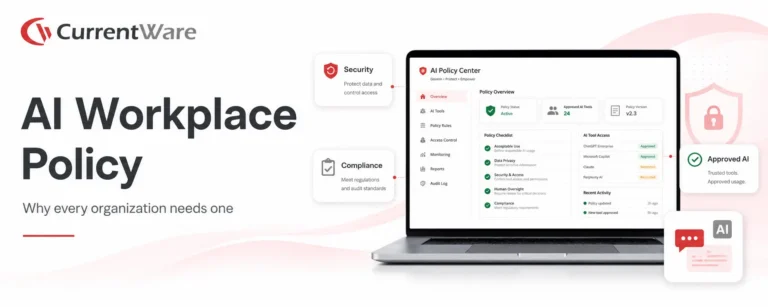
A tool list without a published policy is hard to enforce and harder to defend. Our free AI workplace policy template and workplace monitoring policy template cover the acceptable-use and disclosure language most teams need before the first report goes out.
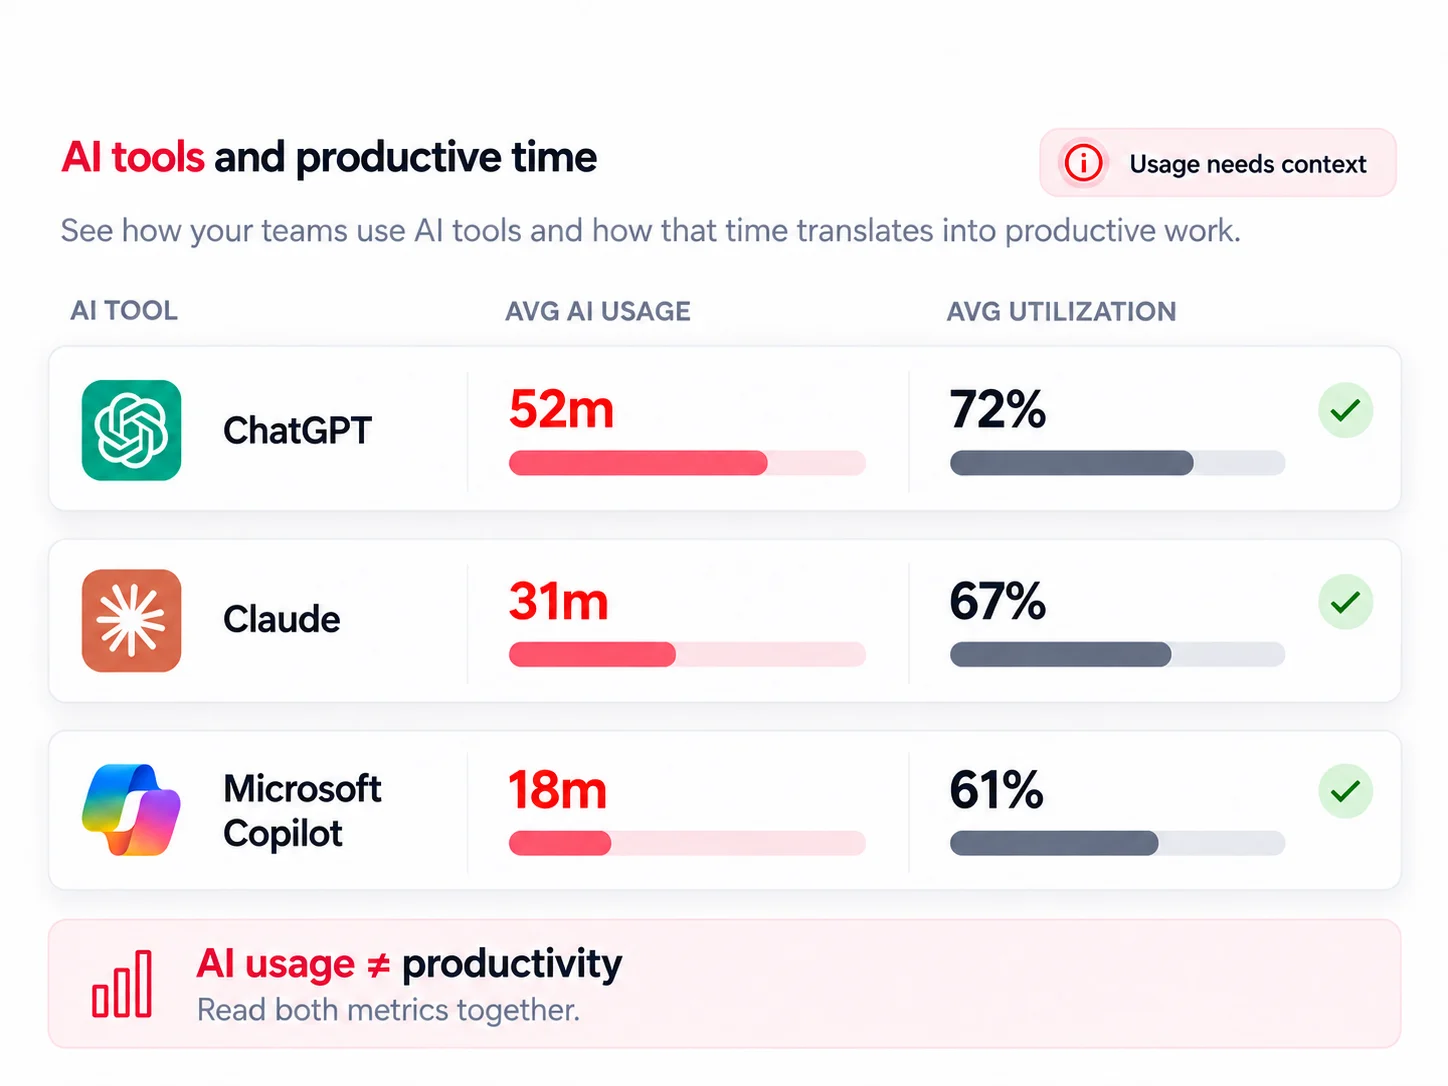
AI usage, measured against productive time
An AI usage number on its own invites the wrong conclusion in both directions. High usage looks like productivity. Low usage looks like resistance. Neither holds up without a denominator.
- User-level utilization appears alongside AI usage in the breakdowns.
- Each AI tool shows the average utilization associated with the people using it.
- The department heat map toggles between AI usage and utilization rate, so you can read the same teams on both axes.
If your managers prefer productive hours to percentages, utilization targets can be configured either way – see version 12.0.5. For the wider picture, see employee productivity tracking and measuring AI productivity impact.
Get it into stakeholders’ hands automatically
The reporting habit fails when someone has to rebuild the deck every month. Set it once.
| Email subscriptions Schedule the dashboard to the people who ask for it, so the numbers arrive before the question does. | PDF and Excel exports Export for board packs, audit evidence, or further analysis in your own models. | Sortable grids and search Sort any grid column and search by user name when you need to answer one specific question fast. |
|---|
How to get set up
1. Deploy the CurrentWare Client
Install a test group first. The dashboard is enabled by default in the cloud console.
2. Open the AI usage dashboard in BrowseReporter
Select a timeframe; the comparison period is set automatically.
3. Add your approved AI applications and websites
Organization-wide, or per group where sanctioned tools differ.
4. Review organization, then team, then user
Start with adoption and tools in use, use the heat map to find outliers, then drill in.
Built for transparent monitoring in the US, UK, and Canada
Monitoring AI usage is generally lawful across our core markets when it’s disclosed, tied to a legitimate business purpose, and proportionate to it. The practical requirements differ by market.
Note: These are general guidelines, not legal advice. Confirm obligations with your own counsel.
| Market | What tends to matter most |
|---|---|
| United States | Notice and consent expectations vary by state, and some states require written notice before electronic monitoring. State privacy laws add rights around employee data in several jurisdictions. |
| United Kingdom | UK GDPR requires a lawful basis, transparency, and data minimisation, and ICO employment guidance expects a documented impact assessment for systematic monitoring. Collecting activity metadata rather than prompt content supports the minimisation argument. |
| Canada | PIPEDA and provincial privacy laws apply, with additional rules in Alberta, British Columbia, and Quebec. Ontario employers above the statutory threshold must maintain a written electronic monitoring policy. |
Activity-level measurement vs prompt capture
AI monitoring tools split into two philosophies. One captures the conversation – prompts, responses, uploads, often session video. The other measures the activity. Both have a place, and they carry very different risk and rollout costs.
How the two approaches differ in practice
| Consideration | CurrentWare AI usage dashboard | Prompt-capture AI monitoring |
|---|---|---|
| What’s collected | AI application and website activity, time, user, team, utilization | Prompt text, responses, uploads, often session recordings |
| Shadow AI discovery | Yes, via approved-tool list and unapproved activity reporting | Yes, usually with content inspection attached |
| Rollout friction | Lower – no message content is read | Higher – typically needs works council or legal review |
| New sensitive data created | None beyond activity metadata | A searchable archive of employee-entered content |
| Adoption and ROI reporting | Built around adoption, depth of use, maturity, utilization | Usually secondary to risk and forensics |
| Deployment | Cloud for this dashboard; on-premises available for the suite | Frequently cloud-only |
Weighing specific vendors? See our ActivTrak alternative, Teramind alternative, and Insightful alternative pages.
Built to Support Your Compliance Program
Discover how organizations use CurrentWare’s employee monitoring software to improve visibility, strengthen compliance efforts, and manage employee activity more effectively.
-
CMMC Compliance →

CMMC
Endpoint Restriction to Protect CUI & FCI
-
NIST 800-171 Compliance →
NIST 800-171/53
Protect Controlled Unclassified Information
-
ISO 27001 Compliance →

ISO 27001
Increase the Maturity of Your ISO27K ISMS
-
HIPAA Compliance →

HIPAA
HIPAA protects sensitive patient data
-
Cyber Essentials Compliance →
Cyber Essentials
Critical Security Controls For Your Assessment
-
GDPR Compliance →

GDPR
EU’s data protection and privacy law
-
NERC CIP Compliance →

NERC CIP
Protect TCAs & BCSI From Insider Threats
-
CIPA Compliance for Education →

CIPA for Education
Qualify for the FCC’s E-Rate Program
Pick & Plug Into Your Existing Stack
CurrentWare works alongside the identity, security, and directory tools you already use, including support for SAML, OIDC, and CEF standards. Cloud connectors are on the way.
- Tested & supported
- Generic standards (SAML, OIDC, CEF)
- On the roadmap (Cloud)


Keep reading
Articles
-
AI Monitoring
How To Track AI Usage With Employee Monitoring Software
Why AI Usage Monitoring Is Now Mission-Critical AI tools are now part of daily work for most teams. People use…
-
AI Monitoring
Shadow AI Security Risks Governance
You locked down USB ports. You deployed web filtering. You trained your users on phishing. Then someone on the finance…
-
-
AI Monitoring
AI Workplace Policy
Corporate investment in generative AI is soaring, with average budgets expected to grow by nearly 60% over the next three…
-
AI Monitoring
How to Monitor AI in the Workplace Risks and Solutions
The rise of AI tools like ChatGPT, Gemini, Midjourney, and Copilot is reshaping workplaces, with employees adopting these tools to…