
See How Much Costs CurrentWare Could Help You Save
Get a conservative business case based on industry-wide savings, not best-case projections.
- Discover total estimated savings in unused software licences
- Estimate annual savings from improved productivity
- Overview total energy savings in $
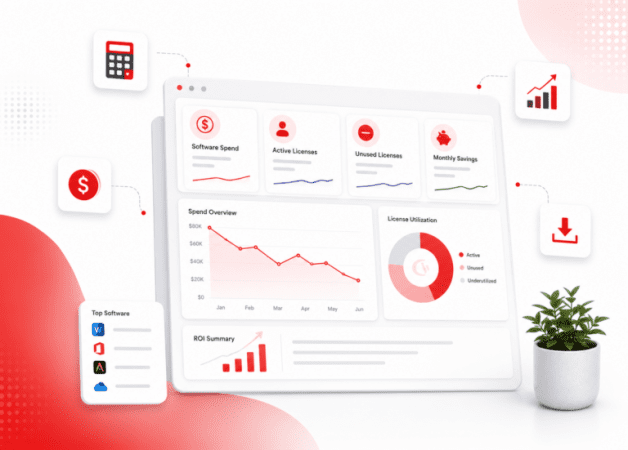

Find out how much you can save on unused software licences
Are rising software costs eating into your annual budgets? It’s a common problem with SaaS businesses. You know some of it is waste. What you can’t say is how much, in which tools, or what it would be worth to cancel. So the renewal comes round, it gets approved because cutting feels riskier than paying, and nothing changes.
That’s just the licences. You’re also paying for capacity nobody tracks and machines left running overnight. This calculator prices all three, in dollars, so you can take a number you can justify in a budget meeting.
Figures in
Employee productivity
BrowseReporterEstimated productivity gain: %
Based on a credible 2024 study.
Software cost savings
BrowseReporterLicenses going unused: %
Gartner’s published floor.
Data loss prevention
AccessPatrol and BrowseControlTypical breach cost, mid-sized company: $3.3M
It varies enormously by size and sector, and stolen intellectual property may not have a price at all.
Device power management
enPowerManagerSaved per machine: 57 watts across 4,000 idle hours
ENERGY STAR and EIA figures.
How much cost can you save using this ROI calculator
Most ROI calculators give you an inflated number.
Our calculator gives you three, each priced in dollars and ranked by how confident you can be in it.
| Software licences: hard cash | Productivity: capacity, not cash yet | Energy: small and verifiable |
|---|---|---|
| Your software bill is headcount × spend per employee. Usage reports show which paid seats go unused. Those licences can be removed at renewal, making this the clearest and largest direct saving. | A 2024 peer-reviewed study found a 7.1% productivity increase after computer monitoring was introduced. But recovered time only becomes savings if it avoids a hire, cuts overtime, or creates billable output. The calculator counts 25% of the gain. | Powering down 175 devices outside working hours saves roughly 39,900 kWh a year, or under $5,000. It is small compared with the other savings, but it is easy for facilities teams to verify. |
How We Calculate Your Estimated Savings
No hidden maths. See exactly how the calculator estimates your savings, along with the research behind each default figure. All sources are from 2023 to 2026.
The formulas
Three rules that keep it honest
- Capacity is not cash. The productivity gain is applied to eligible payroll to size the capacity created, then only the 25% you expect to convert to money enters the ROI. The full capacity is shown separately, below the line.
- Waste is not automatically recoverable. Identified software waste is cut to the 50% share you can actually cancel at renewal. The full opportunity is shown separately.
- We use our highest price. Investment is public list price with no volume discount, so it is the most you would ever pay. Above 100 licenses you pay less, which makes your real return better than shown.
Sources behind the defaults
- Ko & Baek (2024), Management Science 71(1) A field study measured a 7.1% productivity increase after an organization introduced computer monitoring for telecommuting staff, an observed output change rather than a survey estimate. doi.org Used for: the productivity gain default of 7%
- Gartner, 2026 Magic Quadrant for SaaS Management Platforms Through 2028, organizations without centralized visibility into their SaaS portfolio will overspend by at least 25% on software, driven by unused entitlements and overlapping tools. Used for: the unused license default of 25%
- Zylo, 2026 SaaS Management Index Median SaaS spend is $9,455 per employee per year. zylo.com Used for: the fallback software spend estimate when you leave the spend field blank
- US Bureau of Labor Statistics, Employer Costs for Employee Compensation, March 2026 Private-industry employer cost averaged $46.60 per hour worked, roughly $97,000 a year per person. bls.gov Used for: context on the $52,000 annual cost default, set deliberately below the US average
- ENERGY STAR and US EIA A desktop draws roughly 60 W left on and about 3 W in managed sleep. US commercial electricity averages about 13.5 cents per kWh. energystar.gov Used for: the energy lever defaults of 60 W, 3 W and $0.12/kWh
- CurrentWare store page, August 2026 Suite $20; BrowseReporter $12; AccessPatrol $12; BrowseControl $6; enPowerManager $6 per user per month, billed annually. Minimum annual contract $1,440 USD. Volume discounts from 100 licenses. currentware.com/store Used for: all pricing and the minimum contract floor
Every default is set below the research. Here's by how much
| Assumption | This calculator | Published research | Why this figure |
|---|---|---|---|
| Annual cost per employee | $52,000 | $97,000 US private-industry average | Deliberately below average |
| Productivity gain | 7% | 7.1% measured (Ko & Baek 2024) | Rounds the measured figure |
| Financial realization | 25% | No published figure | Capacity only counts when it becomes cash |
| Computer-based roles | 80% | Varies by organization | Productivity applies only to eligible payroll |
| Unused software licenses | 25% | At least 25% (Gartner) | At the published floor |
| Cancellable at renewal | 50% | No published figure | Contracts and bundles limit what you can cut |
| Software spend per employee | $9,455 fallback | $9,455 median (Zylo) | Used only if you leave the field blank |
| Volume discount applied | None | Available from 100 licenses | Overstates your cost |
Source: BLS ECEC March 2026; Gallup State of the Global Workplace 2026; Zylo 2026 SaaS Management Index; CurrentWare store page, August 2026.
How It Works (Simple Steps)
Three steps. No sign-up, no waiting, no emails.
Adjust the inputs
Defaults are loaded already. Change your licence count, hourly cost and software spend, or leave them and see the benchmark case.
Watch the result move
ROI, payback period and net annual benefit recalculate as you type. Switch any lever off to model it out entirely.
Keep or share it
Copy a link that carries your figures with it, email yourself the summary, or print to PDF for a budget pack.
You can also build multiple scenarios and compare outcomes. Change the license count, switch products, or drag the sliders to see how each assumption moves the return.
Validate the Estimate With Your Own Baseline
This calculator is a model, not a measurement. Here’s how you can replace every assumption on this page with a measured figure before you put it in front of anyone.
- Measure a two-week baseline. Run BrowseReporter, BrowseControl and AccessPatrol in monitor-only mode to capture current application, web and device activity.
- Find your own waste. Pull real unused-licence and avoidable-activity figures from your usage reports, in place of the benchmark defaults above.
- Introduce the policies you’ll actually use. Roll out the filtering, device controls and management conversations you intend to keep.
- Compare like for like. Measure an equivalent post-implementation period against your own baseline, not against this model.
- Swap the defaults for your figures. At that point the estimate stops being a model and becomes a validated, company-specific result.
Talk to us to get a clear picture of your cost savings.
A calculator can’t see your tooling, your headcount mix or your renewal preferences but a 20-minute call with our experts can, including when the answer is that CurrentWare isn’t the right fit for you. What you get:
- Your calculator inputs arrive with the request, so you never repeat yourself
- A volume-discounted quote for your actual licence count
- A Cost Insights walkthrough on real software usage data
- Deployment options: cloud, self-managed cloud or on-premises
Built for the people who have to defend the software spend
IT Teams
Cut licence waste and control costs with real application usage data, not renewal-time guesswork.
Finance Teams
Forecast more accurately and walk into contract negotiations with usage evidence behind you.
Executives
Justify software spend with figures that survive scrutiny because the assumptions are sourced and deliberately low.
Teams that already found the savings
Two customers who used usage data to cut spend, not just estimate it.


Ready to Unlock Hidden Savings?
Stop paying for software you don't use. Two weeks of your own usage data beats any calculator. Deploy BrowseReporter on up to 10 computers, free.
Frequently asked
Frequently Asked Questions:
-
A software cost savings calculator helps IT and finance teams estimate potential savings from eliminating unused licenses, reducing SaaS overspend, and optimizing software budgets. With CurrentWare’s calculator, you can forecast ROI by identifying cost reduction opportunities in your IT environment.
-
A SaaS ROI calculator compares the total cost of your software subscriptions with the value gained from active usage. By tracking license utilization, renewal costs and adoption rates, IT teams can see whether their SaaS investments are delivering measurable returns.
-
An effective IT cost savings calculator should consider the number of unused or underutilized licenses, subscription renewal timelines, departmental software usage patterns, shadow IT and unsanctioned apps, and compliance and audit requirements. These are the same insights provided by CurrentWare’s Cost Insights tool.
-
Every default sits at a published benchmark dated between 2023 and 2026. The productivity gain of 7% references Ko and Baek’s 2024 field study in Management Science. The unused license default of 25% references Gartner’s 2026 Magic Quadrant for SaaS Management Platforms. The software spend fallback of $9,455 per employee references Zylo’s 2026 SaaS Management Index. The $52,000 annual cost per employee sits deliberately below the US private-industry average of roughly $97,000 reported by the Bureau of Labor Statistics. All pricing comes from the CurrentWare store page.
-
The accuracy depends on the quality of your usage and cost data. By integrating license tracking and software metering, tools like CurrentWare provide reliable, real-world insights to support accurate IT budgeting and financial forecasting.
-
The CurrentWare Suite is $20 USD per user per month billed annually. Individually, BrowseReporter and AccessPatrol are $12, BrowseControl and enPowerManager are $6. The minimum annual contract value is $1,440 USD. Volume discounts start at 100 licenses, and education and non-profit organizations may qualify for 10% off.
-
No. It uses public list pricing, so the investment figure is the maximum you would pay. Discounts begin at 100 licenses, which means the return shown is understated for most teams above that threshold. Ask for a quote to see your actual number.
-
Benefits include identifying unused or redundant licenses, forecasting software expenses more accurately, supporting compliance with IT budget policies, and improving collaboration between IT, finance and procurement. With CurrentWare, these benefits are automated through ongoing software usage monitoring.
-
Yes. A key feature of cost savings calculators like CurrentWare’s is detecting unused or underutilized licenses. This allows IT teams to reallocate or cancel subscriptions, reducing waste and improving license compliance.
-
Software spend calculators give IT leaders visibility into SaaS adoption, usage and renewal cycles. This insight enables better vendor negotiations, reduces shadow IT risks, and ensures every subscription delivers measurable business value.
Keep reading
Articles
- Compliance
GDPR Compliance Employee Monitoring and DPIA Guide
When using employee computer monitoring software across the European Union (EU), companies have to find a balance between two legitimate,…
- Compliance
US Employee Monitoring Laws by State
The location from which employees log in remained the same with the introduction of hybrid working; instead, it was the…
- Remote & Hybrid Work
Remote Work Acceptable Use Policy Enforcement
Just providing employees with laptops and VPNs will not be sufficient for protecting a distributed workforce in 2026; IT managers…
- Data Loss Prevention
Prevent Data Exfiltration Remote Laptops
The corporate security perimeter has changed. An employee's company laptop could easily arrive at work on a Monday morning connected…
- Remote & Hybrid Work
Remote Employee Productivity Benchmarking
As distributed and hybrid work become the default operating model in 2026, a new productivity dilemma is emerging for organizations:…
- Product Updates
Currentware Cloud AI Features
AI is changing both how employees work and how IT teams manage the tools they rely on. We are building…


Continue exploring employee monitoring
Turn the estimate into a plan.
Software license optimization
The reports behind lever three: find paid tools nobody opens before the renewal lands.
SolutionEmployee monitoring software
How visibility into web, app and idle time works across office, hybrid and remote teams.
SolutionEmployee productivity tracking
Active versus idle time, productivity classification and scheduled reporting.
ProductBrowseReporter
The module that produces the data behind every lever in this calculator.
PricingPlans and pricing
Module and Suite pricing, volume discounts, minimum contract and payment options.
EvidenceCustomer case studies
What other IT teams measured after deploying, including software cost reductions.
ComparisonCurrentWare vs alternatives
Side-by-side against ActivTrak, Teramind, Insightful and others.
TemplateEmployee monitoring starter kit
Policy templates and checklists to roll out monitoring transparently.
TemplatesPolicy template library
Free, editable workplace policy templates covering internet, monitoring and removable media.
Have questions? Talk to a CurrentWare expert.
This tool has been created to give you a sense of the savings you can expect. For more precise, real-world insights, book a demo of our Cost Insights feature. The accuracy depends on the quality of the data you provide.
We respect your privacy. Your data is safe and will not be shared.
Still have questions?
Our team is here to help you.