BrowseReporter User Activity Monitoring Software Overview (Video)
NEW 2023
Updated BrowseReporter Overview Video
NEW 2021
PC Activity Data Dashboards for BrowseReporter
Original Video Transcript
BrowseReporter is a versatile user activity monitoring software that helps organizations enforce policies, meet compliance requirements, and understand how their users operate – no matter where they’re located.
BrowseReporter’s detailed user activity reports provide insights like…
- Are our users following organizational policies? Are there any unwanted activities that need to be addressed?
- How engaged are our users? Do they spend the majority of their time on-task? And…
- Are our users making use of the software we’ve invested in? Should we reduce the number of licenses we pay for?
The computer activity data is collected by a software agent that is installed on your computers. The agent connects to a database on your organization’s network, allowing you to maintain complete control over the data.
Reports
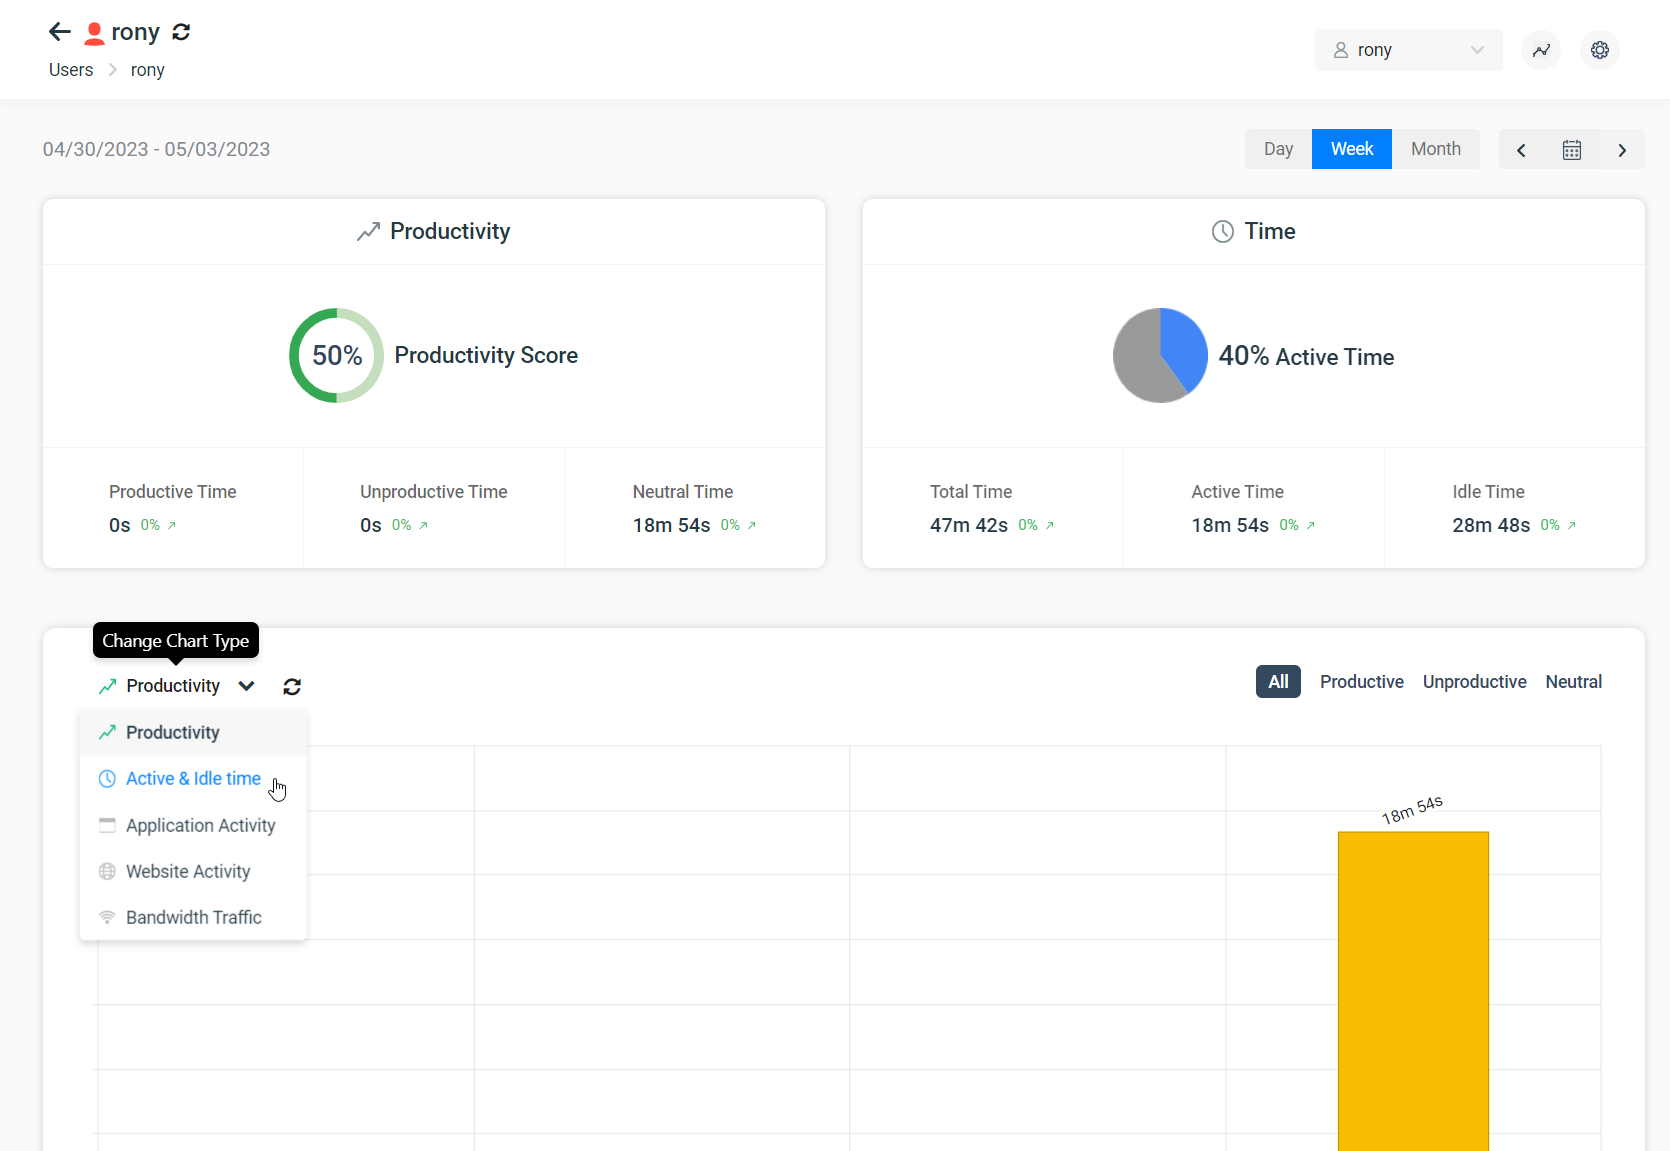
BrowseReporter’s central console allows you to run reports on your user’s computer activities from the convenience of a web browser.
There are dozens of reports to choose from, including…
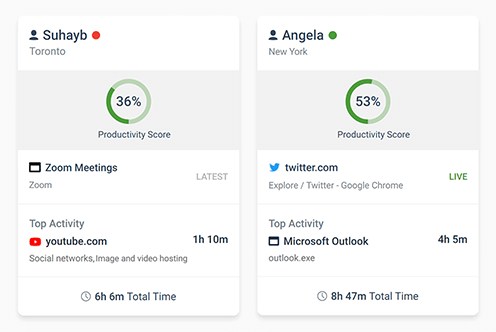
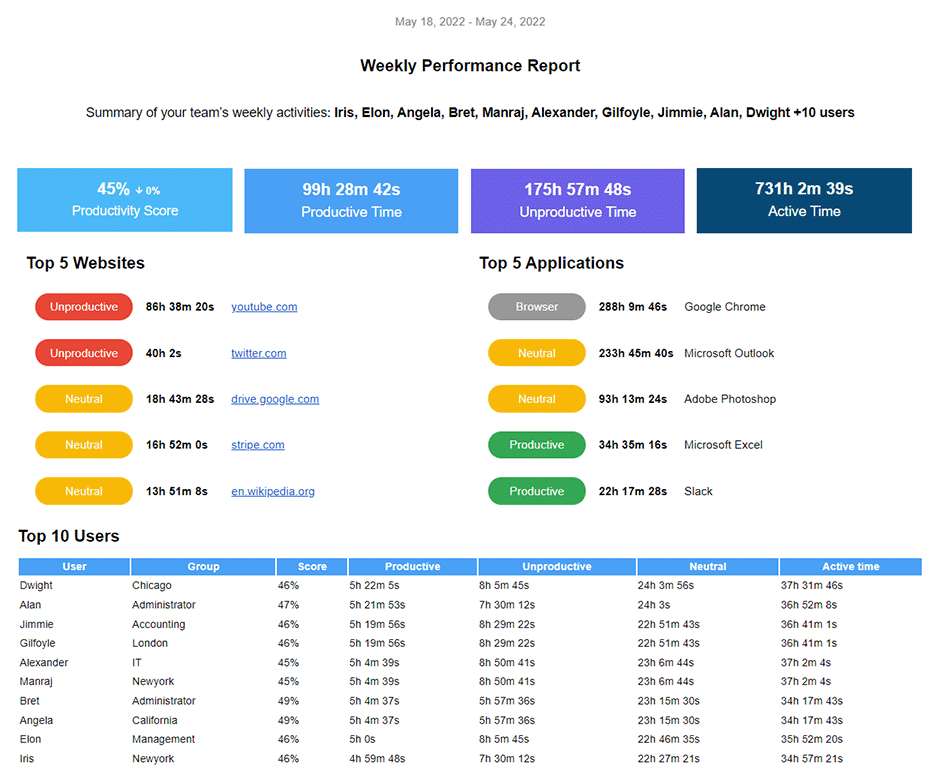
- User productivity reports with an overview of how much time was spent on websites that are productive, unproductive, or neutral. These classifications can be customized to match what is productive for your users.
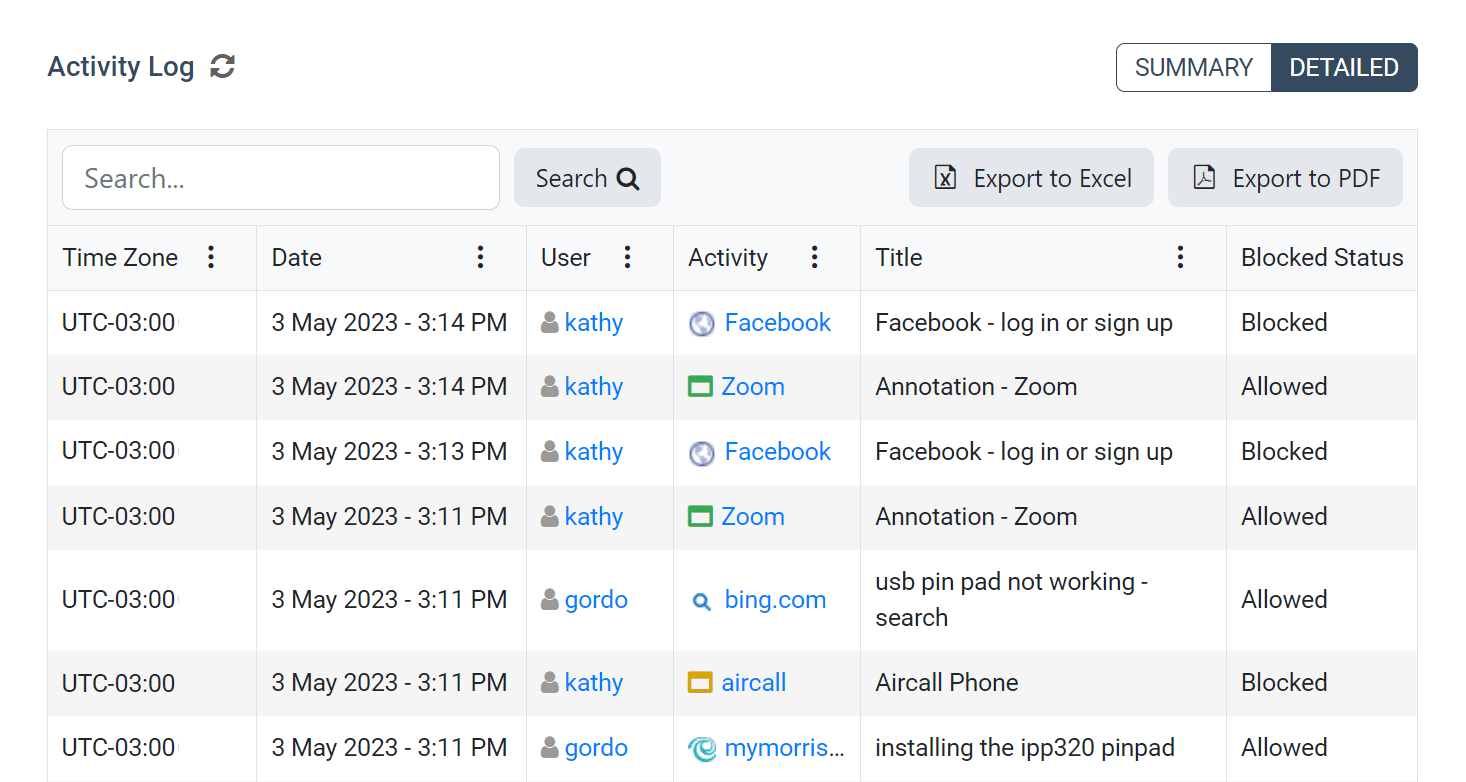
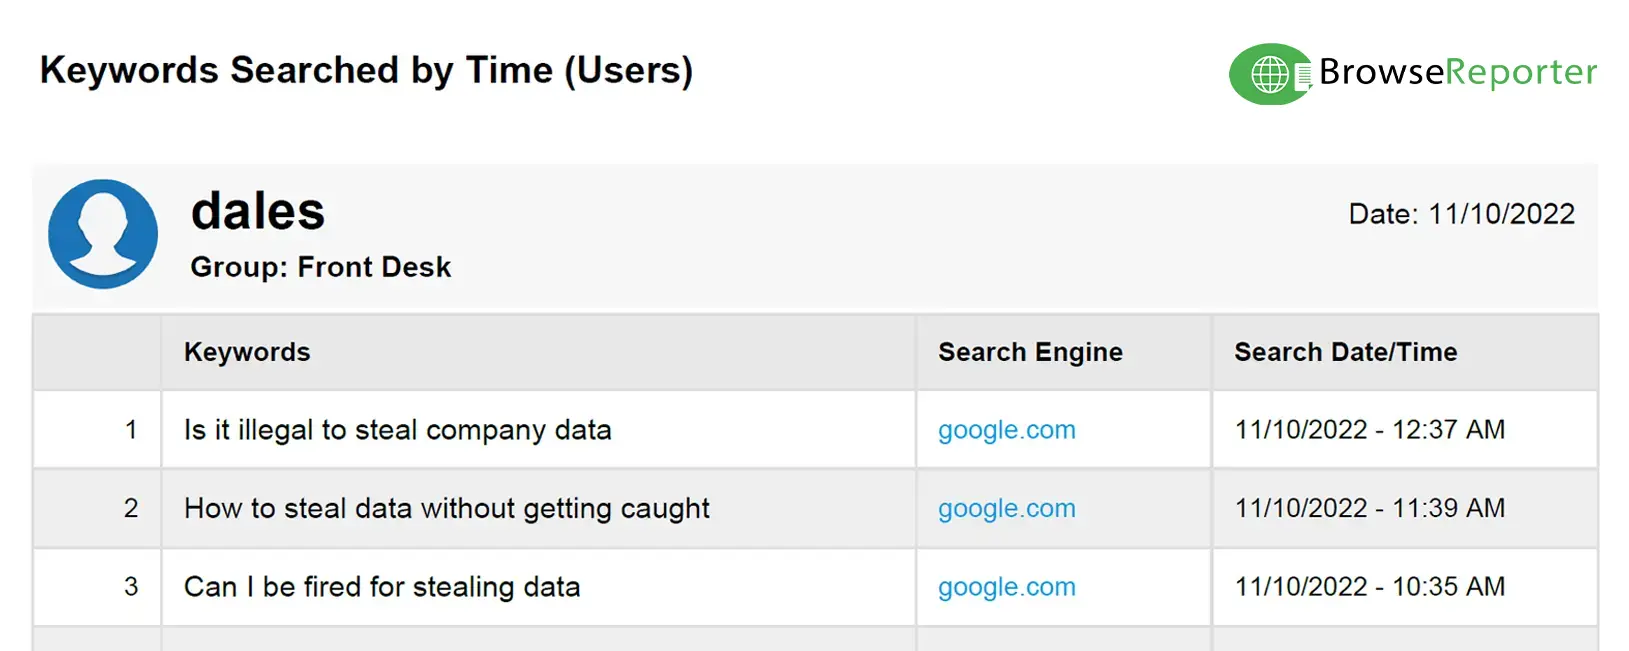
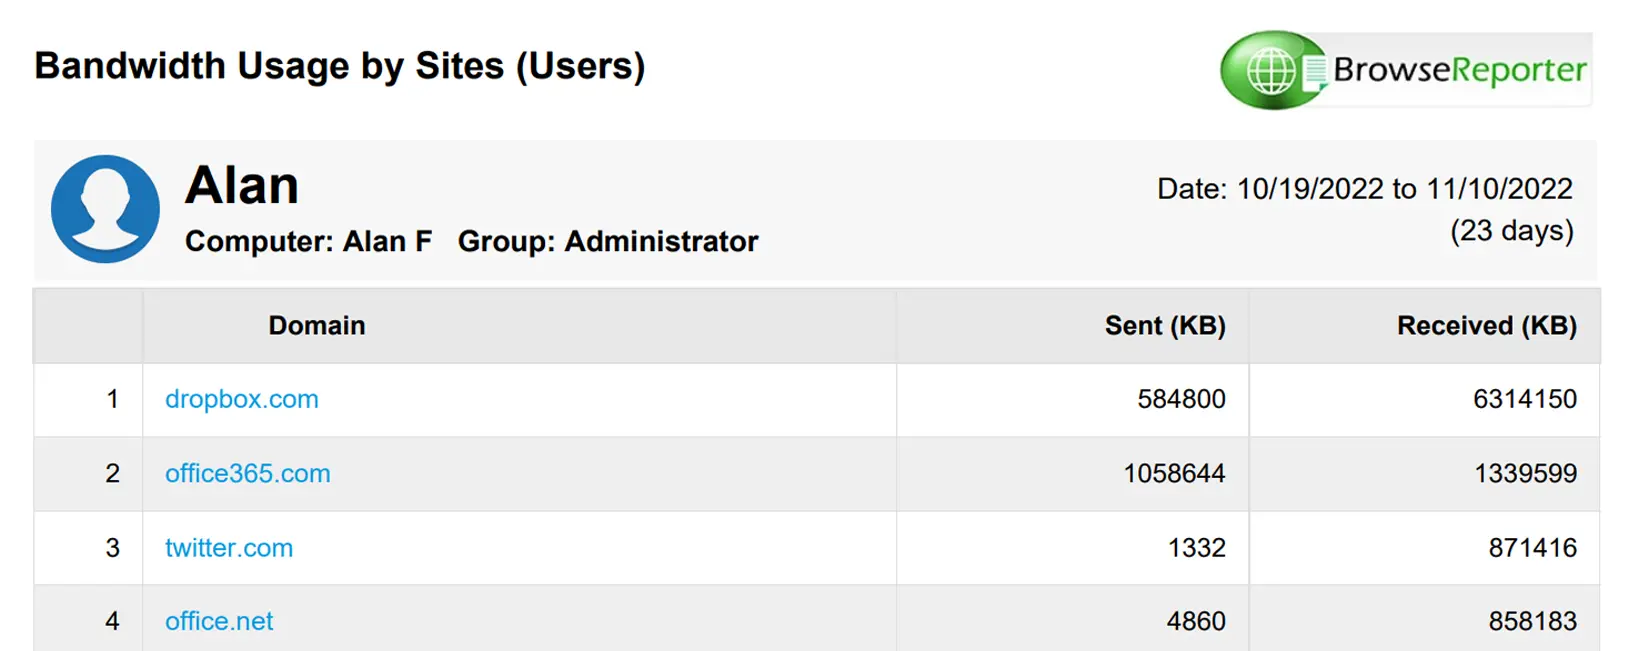
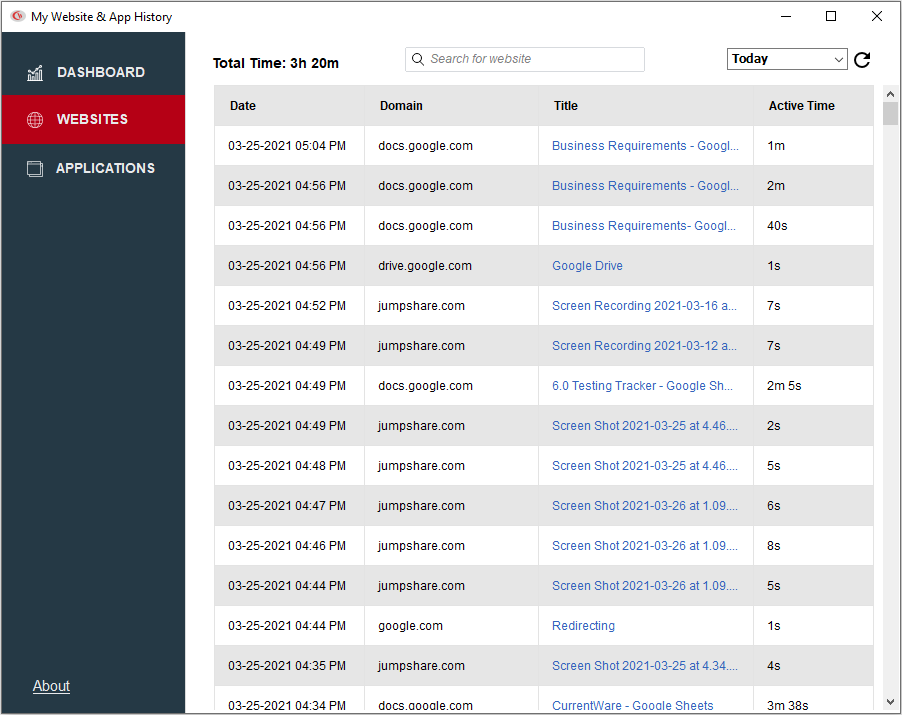
- There are also detailed internet activity reports that show you what websites your users have visited, how long they spent browsing each site, and the amount of bandwidth consumed.
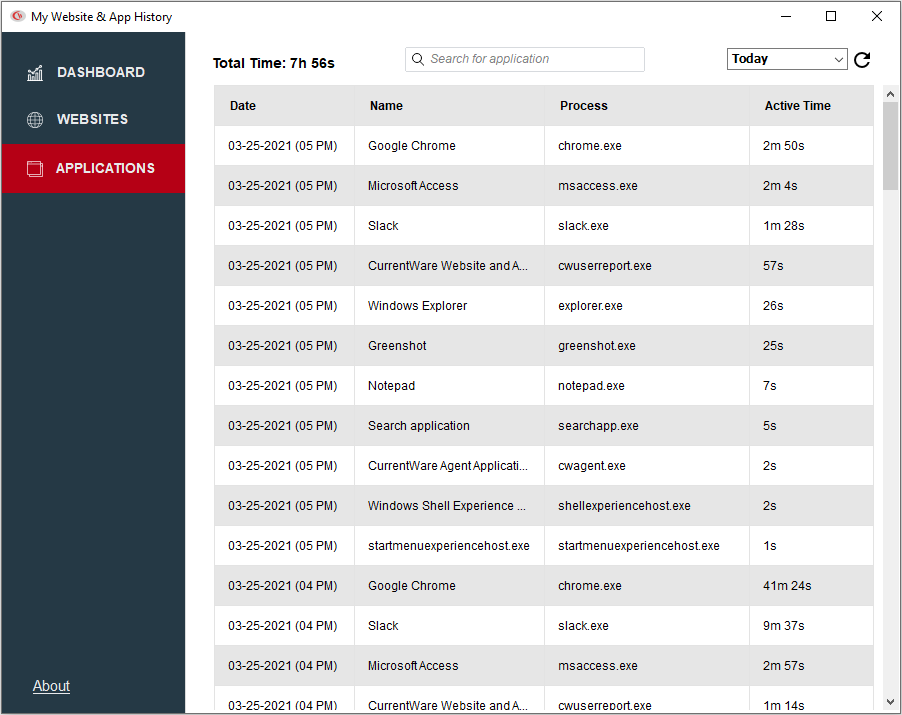
- And finally, the application usage reports show you what software is being used, how long it was used for, and who was using it.
BrowseReporter’s reports can be generated on-demand, on a set schedule, or automatically sent to your inbox to alert you of specific events.
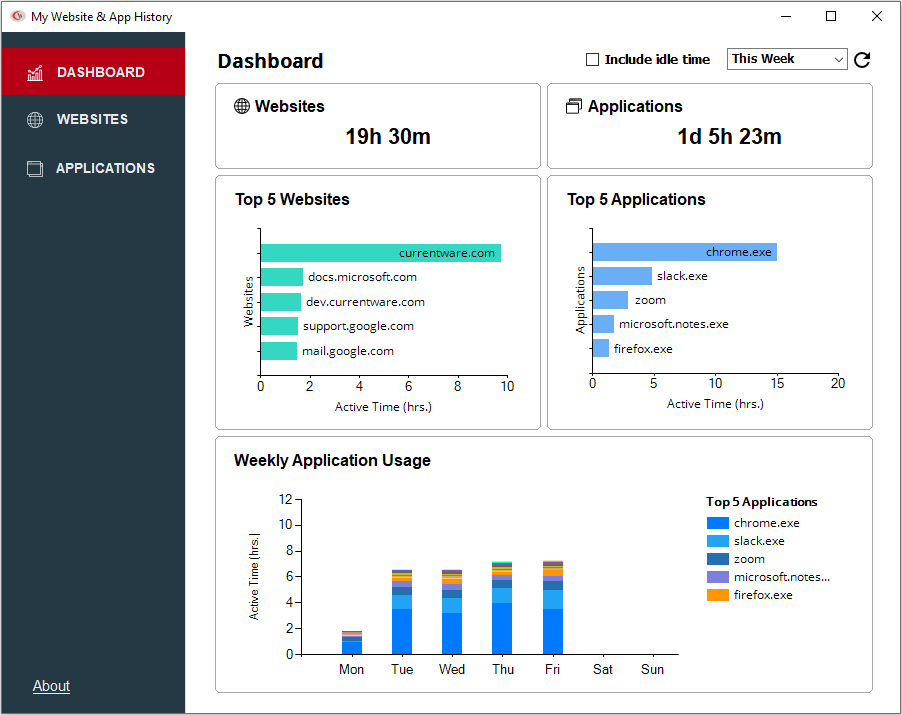
Using the End-User Reports feature you can even provide your users with on-demand access to their own data. This lets them benefit from the insights that you have.
Stealth vs Transparent Employee Monitoring
BrowseReporter can even be deployed with optional privacy-enhancing features.
You can…
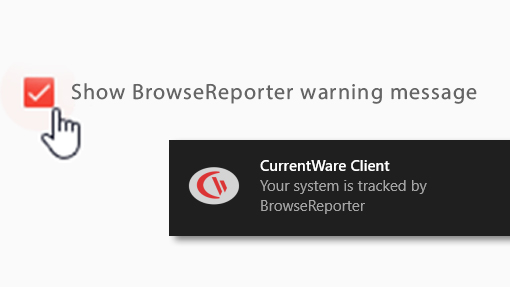
- Display a custom message to notify users that they are being monitored
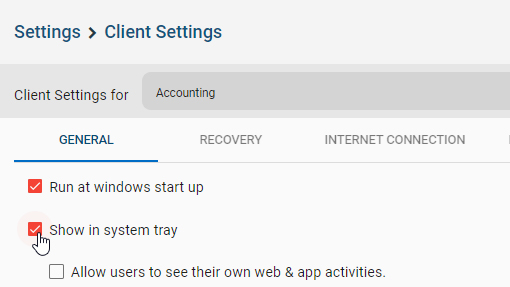
- Make the client visible in the system tray
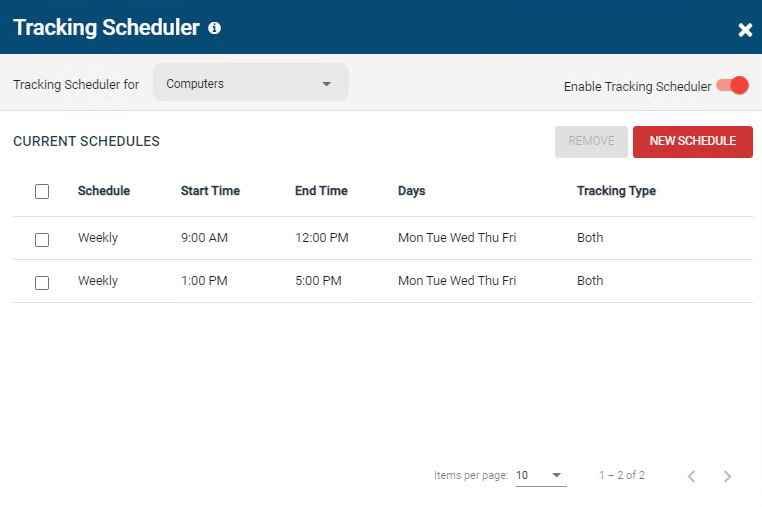
- Stop monitoring outside of standard operating hours, and…
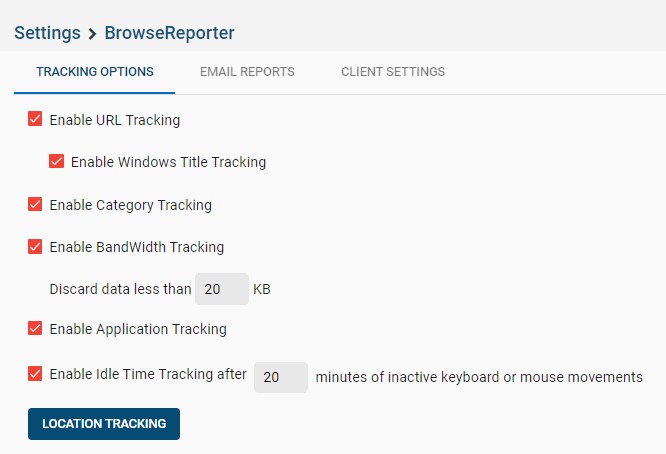
- Disable certain types of tracking altogether
These optional features allow you to customize your BrowseReporter deployment to fit the needs of your organization.
BrowseReporter is best used in tandem with our web filtering software BrowseControl. Using both solutions provides you with the visibility and control you need to ensure that your organization’s computers are being used appropriately
Conclusion
Ready to make data-informed decisions? Get actionable insights into the activity of your users with a free trial of BrowseReporter.
Get started today by visiting CurrentWare.com/Download
If you have any questions during your evaluation our technical support team is available to help you over a phone call, live chat, or email.
Thank you!

Author
Derek B
Customer Success Manager, CurrentWare
Derek is a Customer Success Manager at CurrentWare, dedicated to helping clients realize long-term value from their products. Since 2016, he has worked in the tech sector, driving real ROI through tailored onboarding, proactive support, and strategic guidance on critical solutions like software licence optimization, employee productivity, web filtering and USB device control. Derek fosters strong relationships and cross-functional collaboration to boost retention, satisfaction, and growth, ensuring clients effectively manage productivity and security.

