Browsereporter
Workforce Cost Summary
Translate wasted workforce time into financial impact. Convert unproductive hours into dollar costs so leaders can see where inefficiencies live and what to do about them.
Make Invisible Losses Visible
Without a clear link between time and dollars, workforce decisions rely on guesswork. Workforce Cost Summary quantifies the cost of low utilization and idle time so you can prioritize the changes that matter most.
Quantifies inefficiencies in dollars
Highlights savings & reallocation opportunities
Supports smarter budget & investment decisions
Increases transparency for leadership
Cost Summary Dashboard
The dashboard aggregates productivity data and salary inputs to show:
Cost of baseline shortfall
Cost of idle & unproductive time
Total FTE slack across filters
FTE Slack helps leaders see when underutilization equals one or more full-time
roles, unlocking potential for strategic redeployment.


From Utilization to FTE Slack
This turns abstract “lost time” into tangible cost and staffing insights.
Baseline Shortfall
minimum expected utilization (60%) vs. actual utilization
Cost of Shortfall
dollarized impact of the gap using your salary inputs
FTE Slack
reveals when underutilized hours add up to the equivalent of a full employee, making reallocation opportunities clear
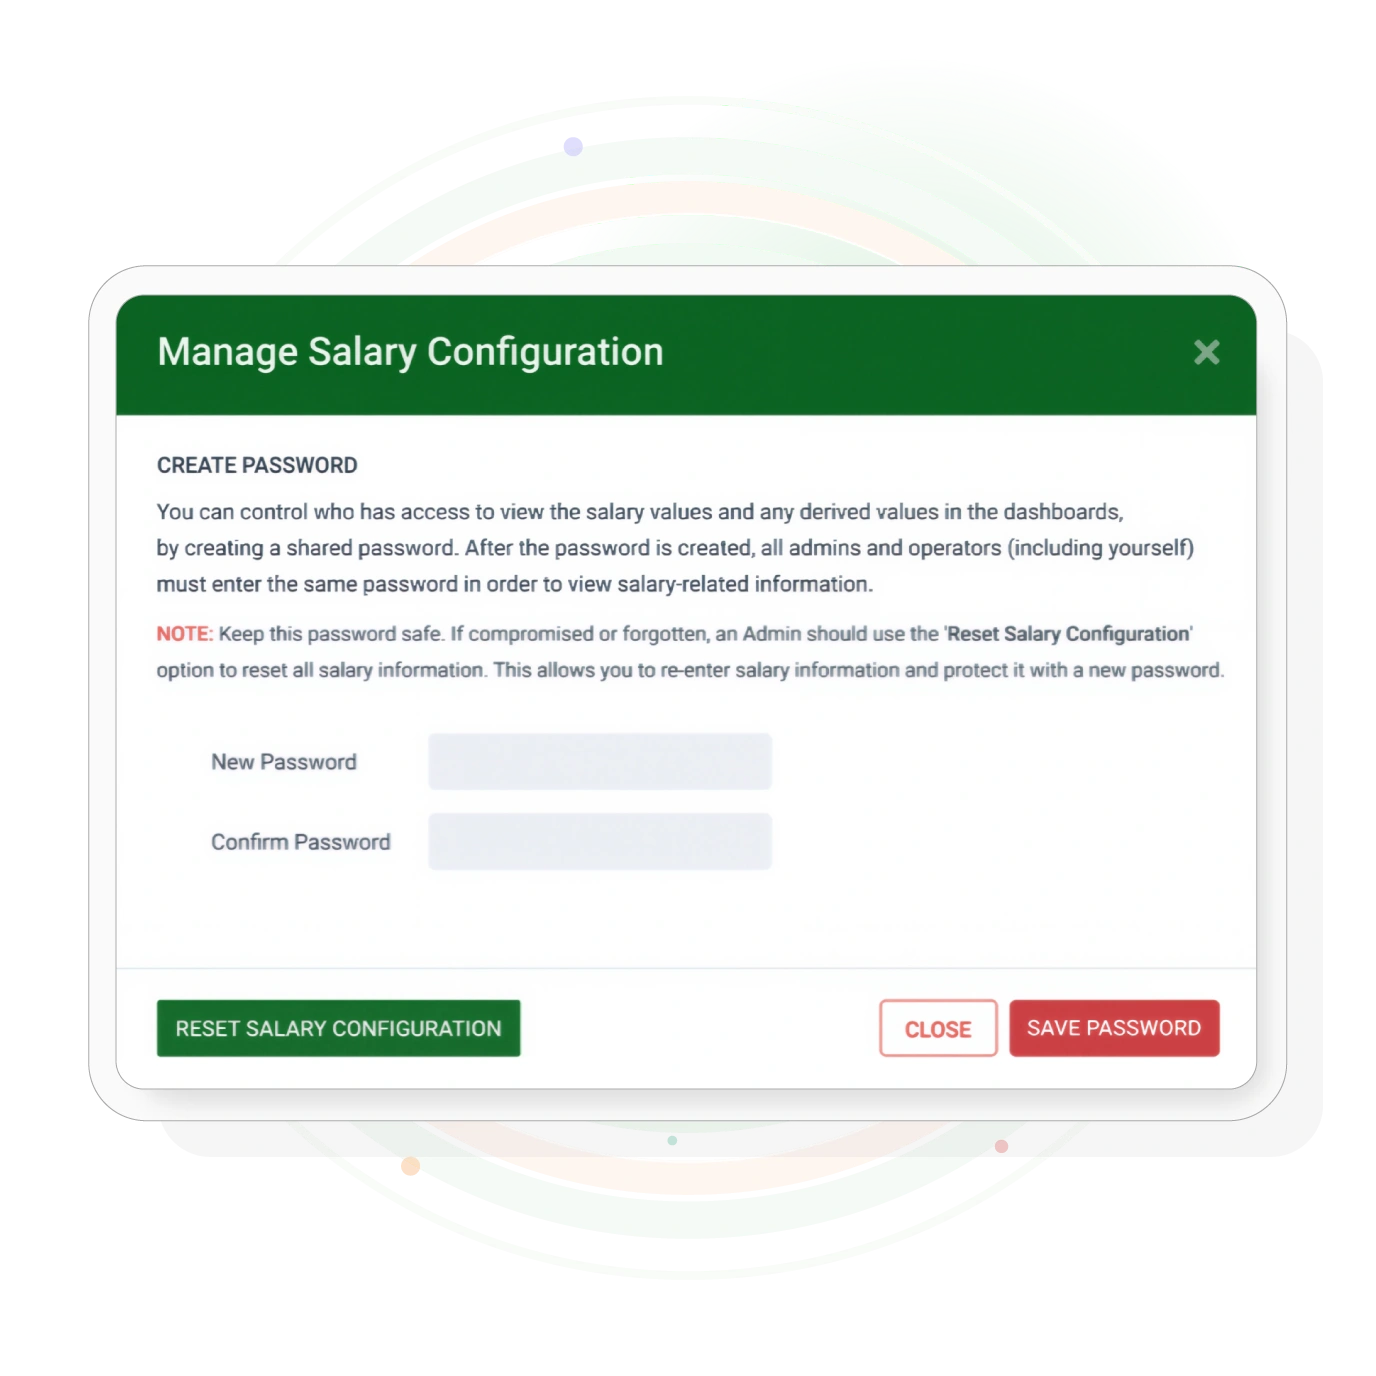
Protect Salary Data
by Design
Your sensitive data is safeguarded with enterprise-grade protections :
Password-gated access to salary & cost fields
Role-based control so only HR or authorized staff see salary
data—even system admins are restricted
Data obfuscation in the database to protect salary details at
rest
Emergency reset options to restore control in case of
compromise
Security and privacy are built into every layer.

Configure in Minutes
- Open Dashboard → BrowseReporter → Dashboard > Utilization > Configuration
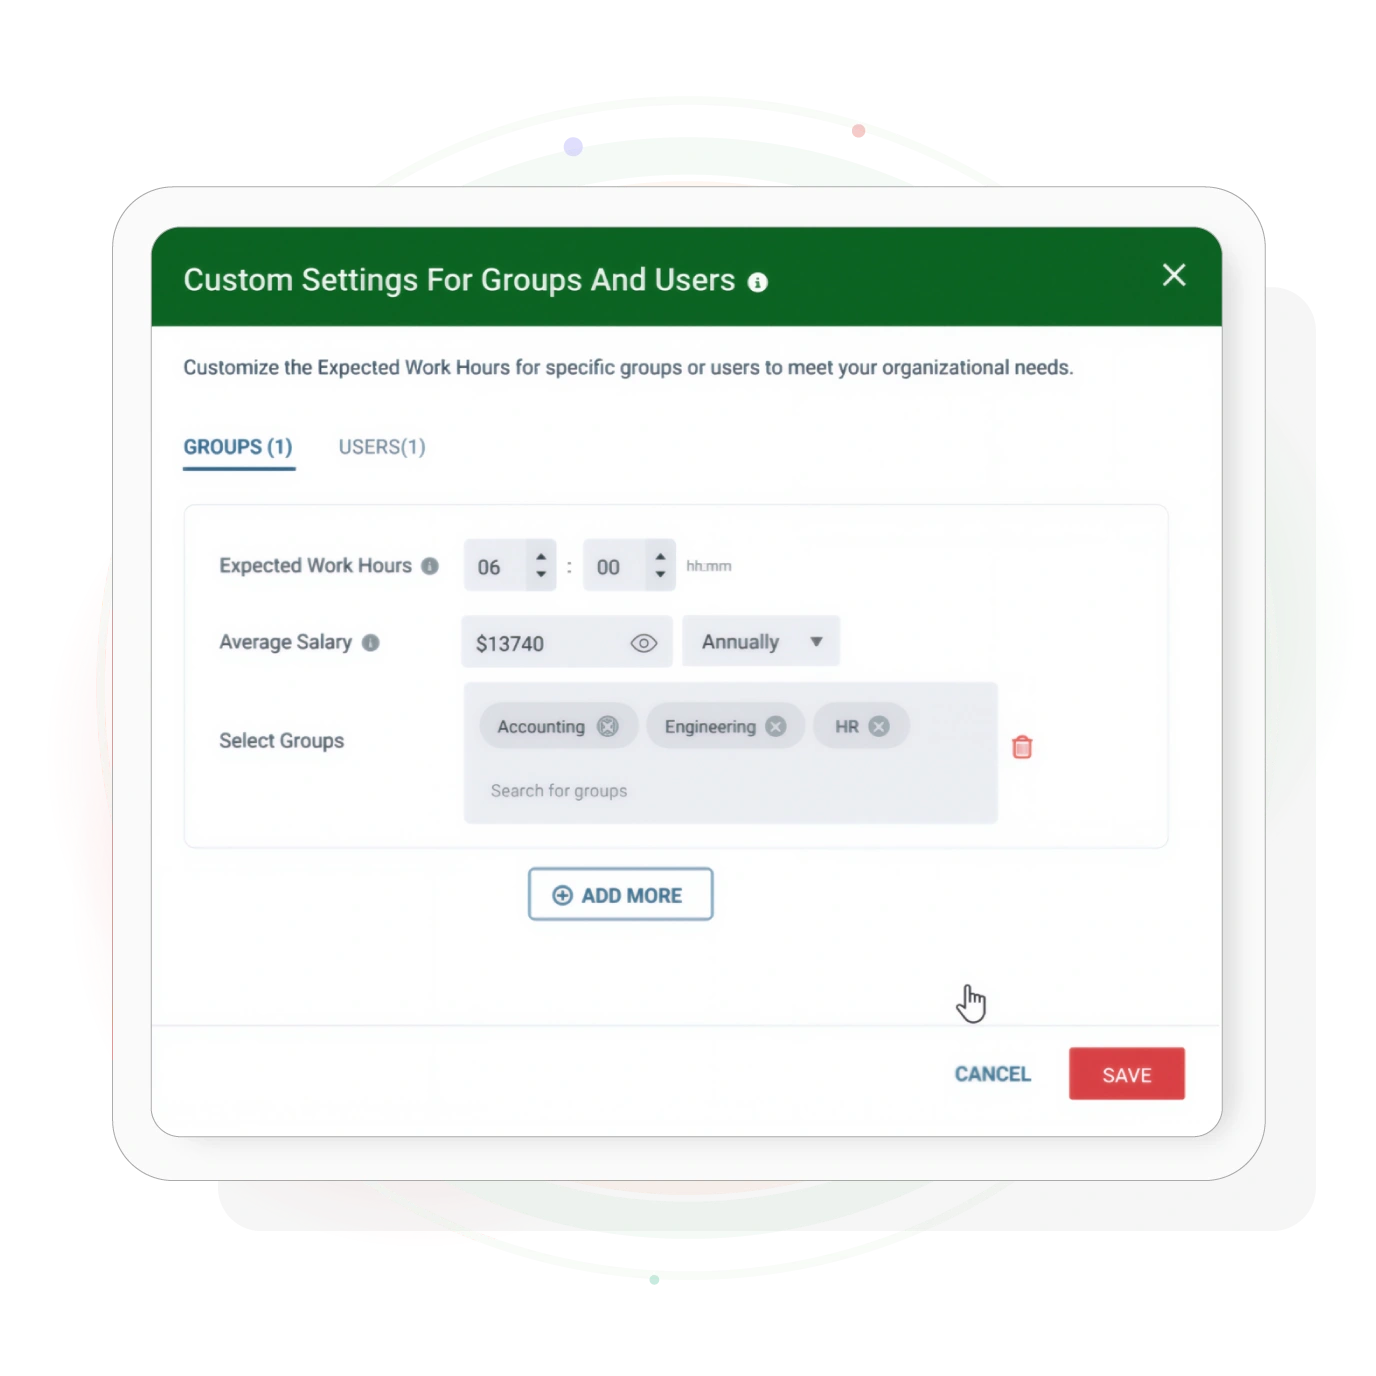
- Set Average Salary (optional) → enable company-wide cost calculations
- Define Custom Salaries → by group or individual for greater accuracy
- Enable Cost Summary → view dollarized losses in Utilization
- Protect Sensitive Data → password-gated access for salary & cost details

💡 Supports three tiers of salary inputs: company-wide average, group-specific rates, or individual user salaries for maximum precision.
Built for Leaders
Enterprise-ready, Workforce Cost Summary empowers all functions to make confident, data-driven workforce decisions.
see the big-picture financial impact of productivity gaps
tie time to budget and investments
pinpoint underutilization and unlock optimization
connect day-to-day gaps with measurable financial outcomes
Example in Action
Scenario
Imagine a team of 50 employees with an average salary of $80,000 per year.
- Baseline Utilization Goal: 60%
- Actual Utilization: 50%
- Shortfall: 10% (~200 lost hours/employee annually)
Financial Impact
wasted salary spend
equivalent sitting idle
Clear reallocation insight: those “lost hours” could fund an entire new project team without additional hiring.
Ready to Turn Time into Dollars?
Quantify productivity gaps, surface savings opportunities, and make confident workforce decisions with Workforce Cost Summary.