
Today’s Insights provide real-time updates on team and user activities, productivity, and availability, giving managers valuable insights into the daily work of their employees. By keeping this information up-to-date and easily accessible, managers can monitor the progress of their team and identify any potential issues or areas for improvement.
With metrics that indicate whether or not employees are at their desks and working, managers can quickly assess the overall productivity of their team and make decisions based on this information. This can help managers to optimize their team’s operations and ensure that they are working effectively and efficiently.
There are 4 views in today’s insight that will give you valuable information about your groups and users.
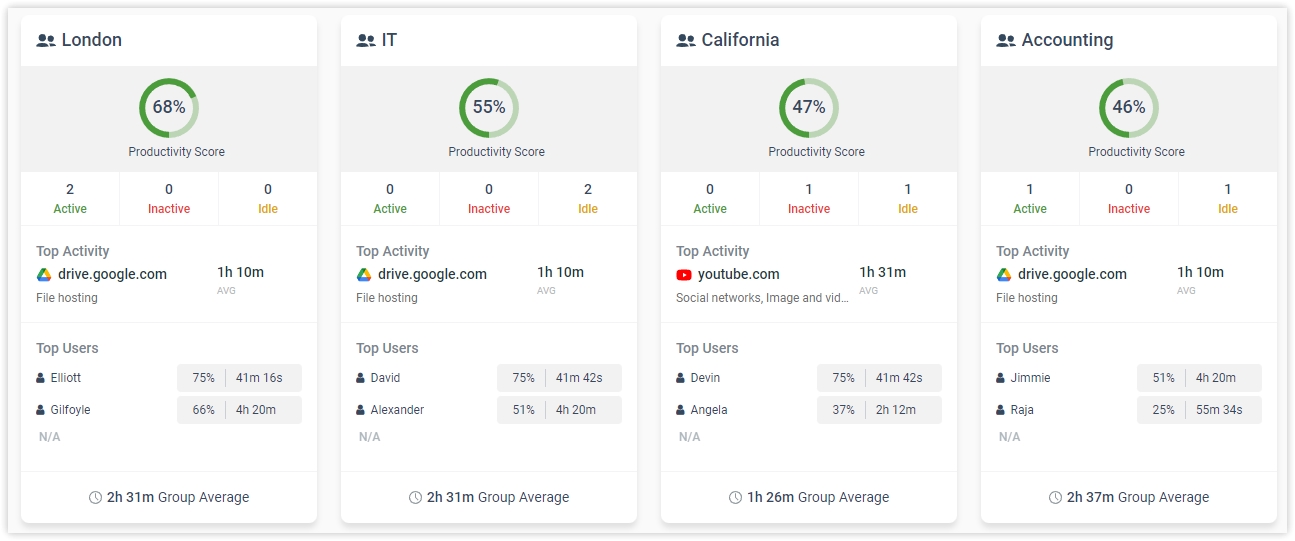
Group’s Card View
The Group’s card display offers an overview of the team’s productivity score, availability, top activities, and total activity time in a compact format. For a more in-depth analysis, simply hover over elements such as the productivity score to view a detailed analysis of productivity levels and time spent.
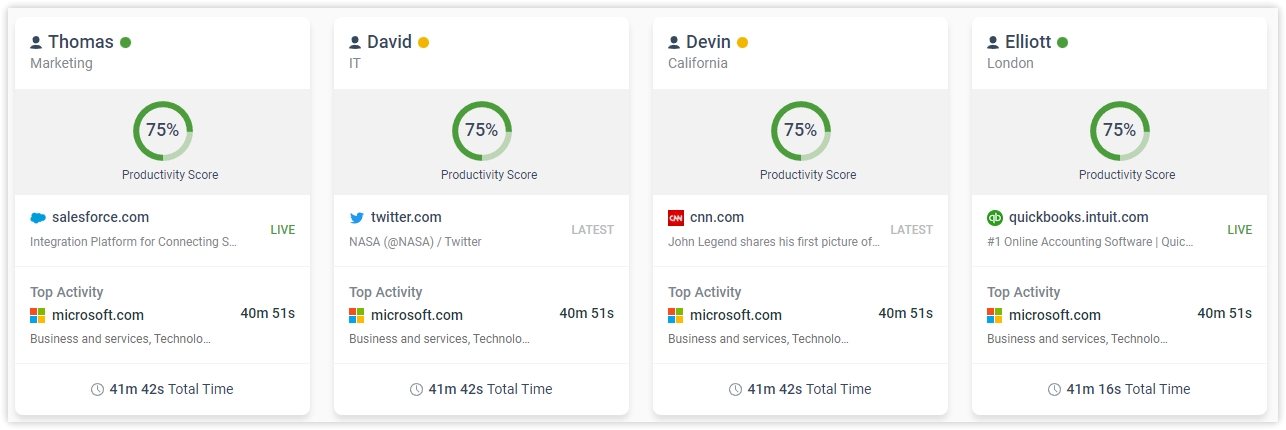
User’s Card View
The User’s card display enables near real-time monitoring of users, displaying the latest task they engaged in and their top three activities of the day. It also displays when the initially signed on and started to work (first seen time) as well as the total active and idle time.

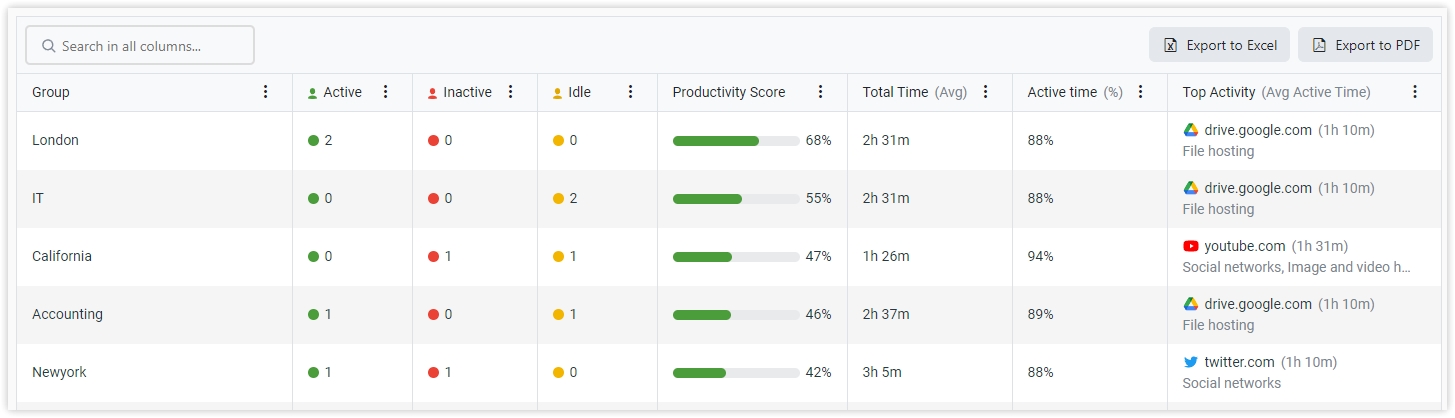
Group’s Table View
The Table view presents team insights in a tabular format, displaying the number of users who are active, inactive, and idle, as well as their productivity score, total time, and leading activity in a single row. The table view allows for customization of the data through the use of filters (to display only active/inactive/idle users), column sorting, and cell search functionality.
User’s Table View
The Table view presents user insights in a tabular format, displaying each user’s current task, productivity score, total time for the day, and leading activity in a single row. The table view allows for customization of the data through the use of filters (to display only active/inactive/idle users), column sorting, and cell search functionality.
User status explained:
- Active (green dot): the user is currently logged in and actively using the computer, such as running an application or browsing the internet.
- Idle (orange dot): the user is logged in but has not interacted with the computer for a specified period of time based on predefined BrowseReporter idle time setting
- Inactive (red dot): the user is not currently logged in to the computer. The user is logged off. The cwClient service is stopped and not reporting to the CurrentWare Server.
Notes:
- Today’s insight is based on data from one day only.
- Card views are limited to 50 cards. To view more than that, use the table view.
- A user’s idle status is determined by the idle time tracking settings in BrowseReporter.
- The data will refresh the current live activity, status (active/idle/inactive) every 30 seconds and the calculated data (productivity score, top activities, total time) every 3 minutes. The view will refresh the data automatically.
- Today’s Insight can be disabled by unchecking “Enable Today’s Insight” from Settings > BrowseReporter. Once disabled, Today’s Insight will be hidden from the menu on the left hand side.
