In addition to the user activity reports BrowseReporter includes 7 dashboards that give you insights on website activities, productivities, application usage and bandwidth consumptions of your entire organization.
With BrowseReporter’s web dashboards, you can keep a pulse of your workforce productivity and computer usage all in one place.
Dashboards:
- Overview
- Productivity
- Websites
- Application
- Bandwidth
- Groups
- Users
Overview
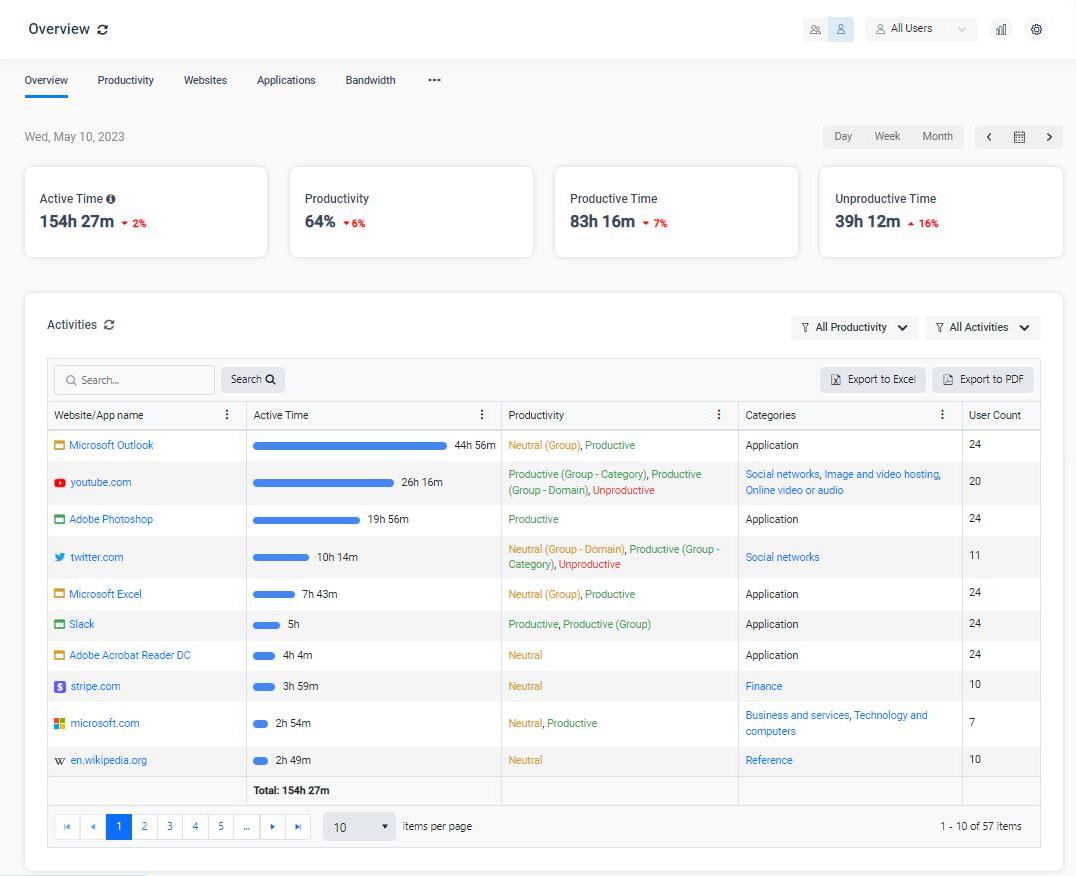
This dashboard provides a quick glance at your team’s website & application activities. Drill down by department/user to gain further insight.
- Productivity Scorecards
- Top Website and Application Activities
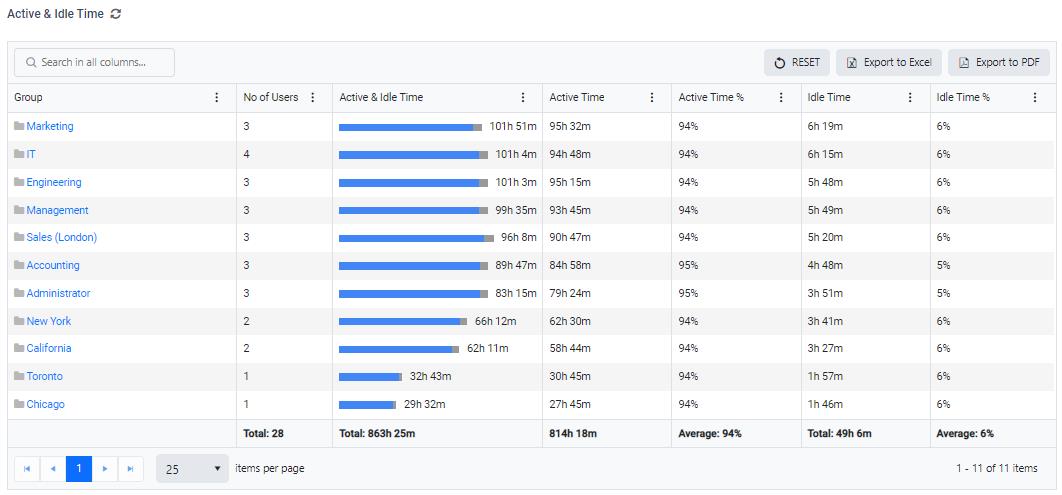
- Top Active and Idle Users
Productivity
This dashboard provides top-level information about your organization’s productivity based on your users’ website activities. Uncover usage patterns and start curbing unproductive behaviors.
- Productivity
- Top 5 productive by groups/users
- Top 5 unproductive by groups/users
- Top 5 categories by productivity
- Top 5 websites by productivity
- Productivity Activity Log
Websites
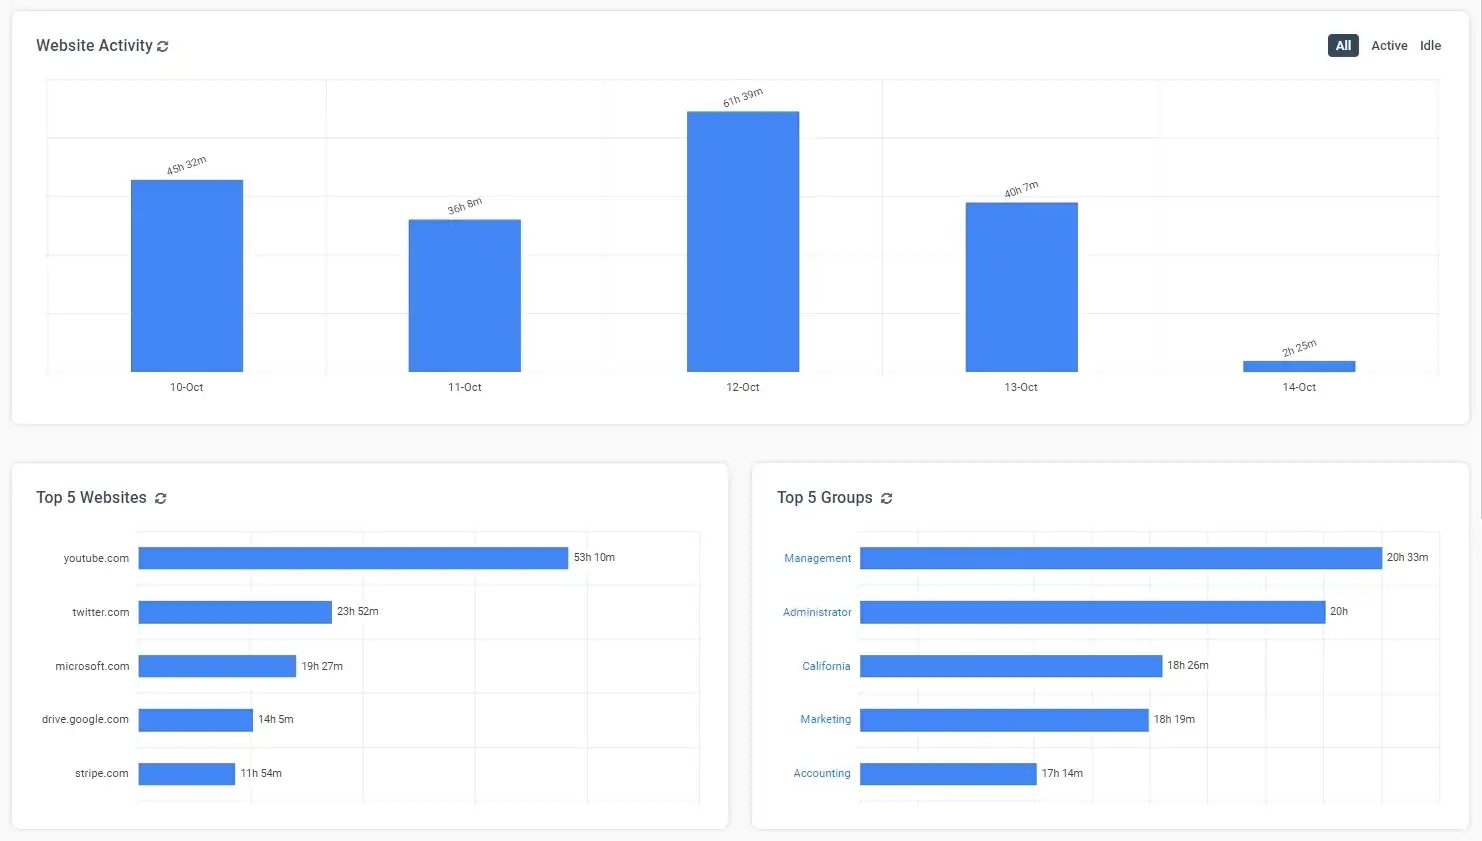
This dashboard provides top-level information about your organization’s website activities. You can drill down to the details of each user’s browsing session.
- Website Activity
- Top 5 websites by groups/users
- Top 5 groups/users by active time
- Websites Activity Summary
- Websites Activity Detailed
- Browsing Date & Time
- User
- Group
- Domain
- Active Time
- URL (optional column)
- Webpage Title (optional column)
- Block Status (optional column)
- Categories (optional column)
- Idle Time (optional column)
Applications
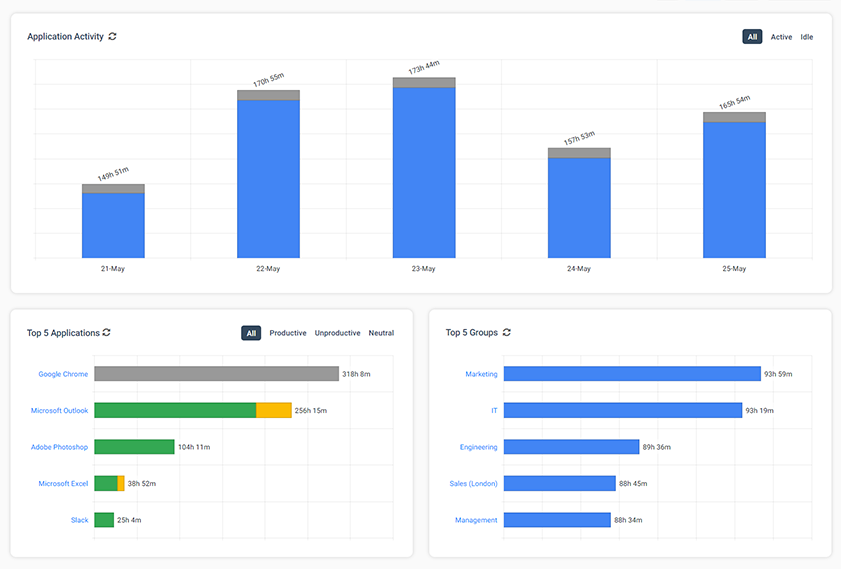
This dashboard provides top-level information about your organization’s application activities. You can drill down to the details of each user’s hourly application sessions. Reduce license costs by uninstalling applications that are redundant or not longer in use.
- Application Activity
- Top 5 Applications by groups/users
- Top 5 Groups/Users by Active Time
- Application Activity Summary
- Application Activity Detailed
- Date & Hour
- User
- Group
- Application
- Active Time
- Application Process (optional column)
- Idle Time (optional column)
Bandwidth
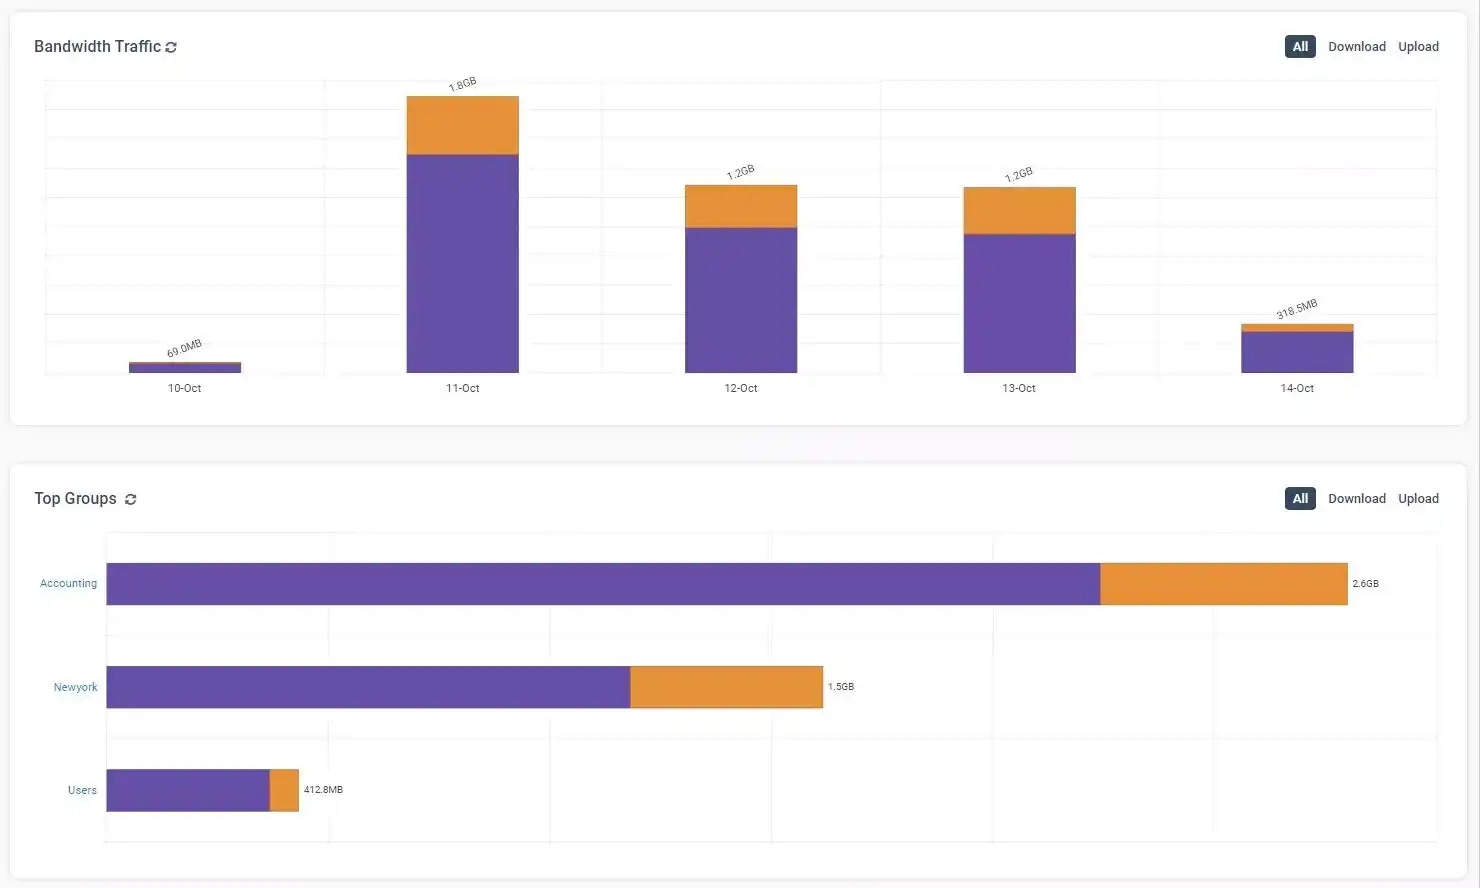
This dashboard provides top-level information about your organization’s bandwidth consumptions.
- Bandwidth Traffic
- Top 5 Groups/Users by Downloads & Uploads
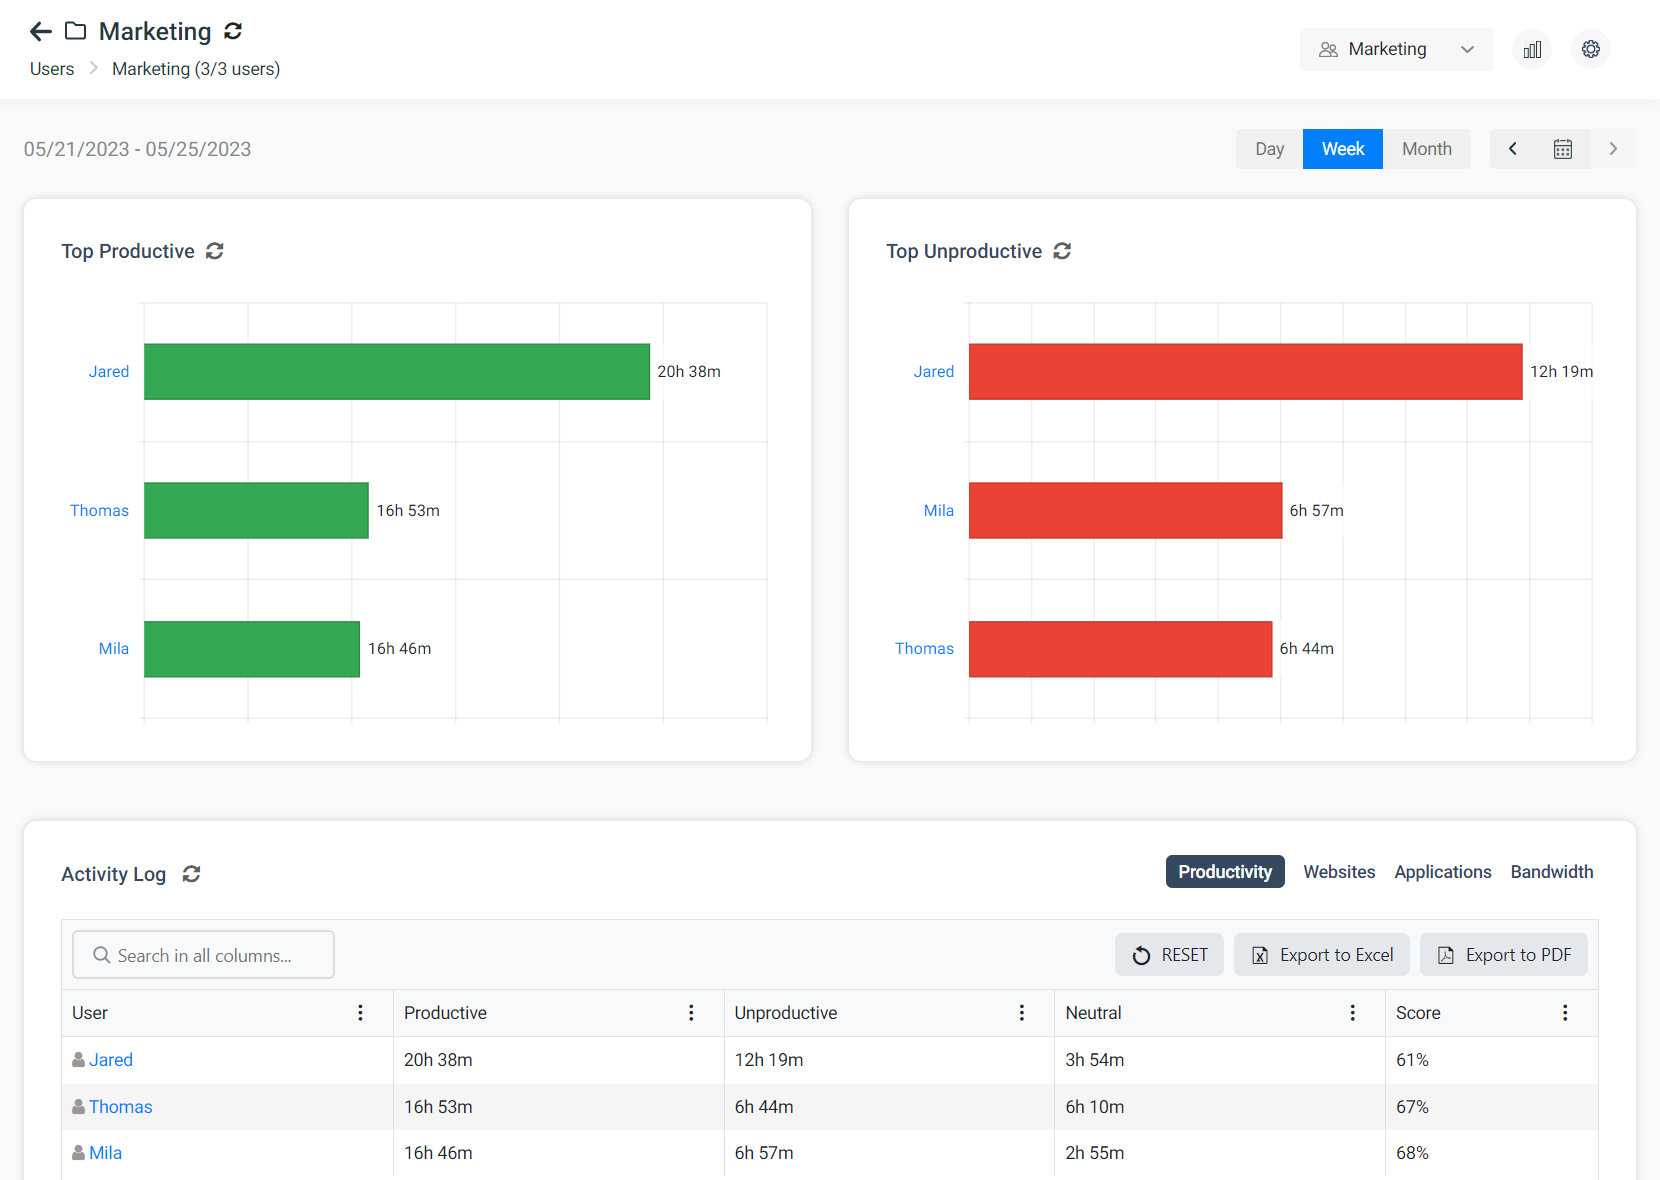
Groups Dashboard

This dashboard provides a summary of your group’s computer activities with the top 5 most productive and unproductive users along with 4 detailed tables summarizing their productivities, websites activities, application usage and bandwidth consumptions. Gain insights into team productivity by understanding their top websites/application usage throughout the day.
- Top 5 Productive Users
- Top 5 Unproductive Users
- Activity Log – Productivity
- Activity Log – Websites
- Activity Log – Applications
- Activity Log – Bandwidth
Users Dashboard
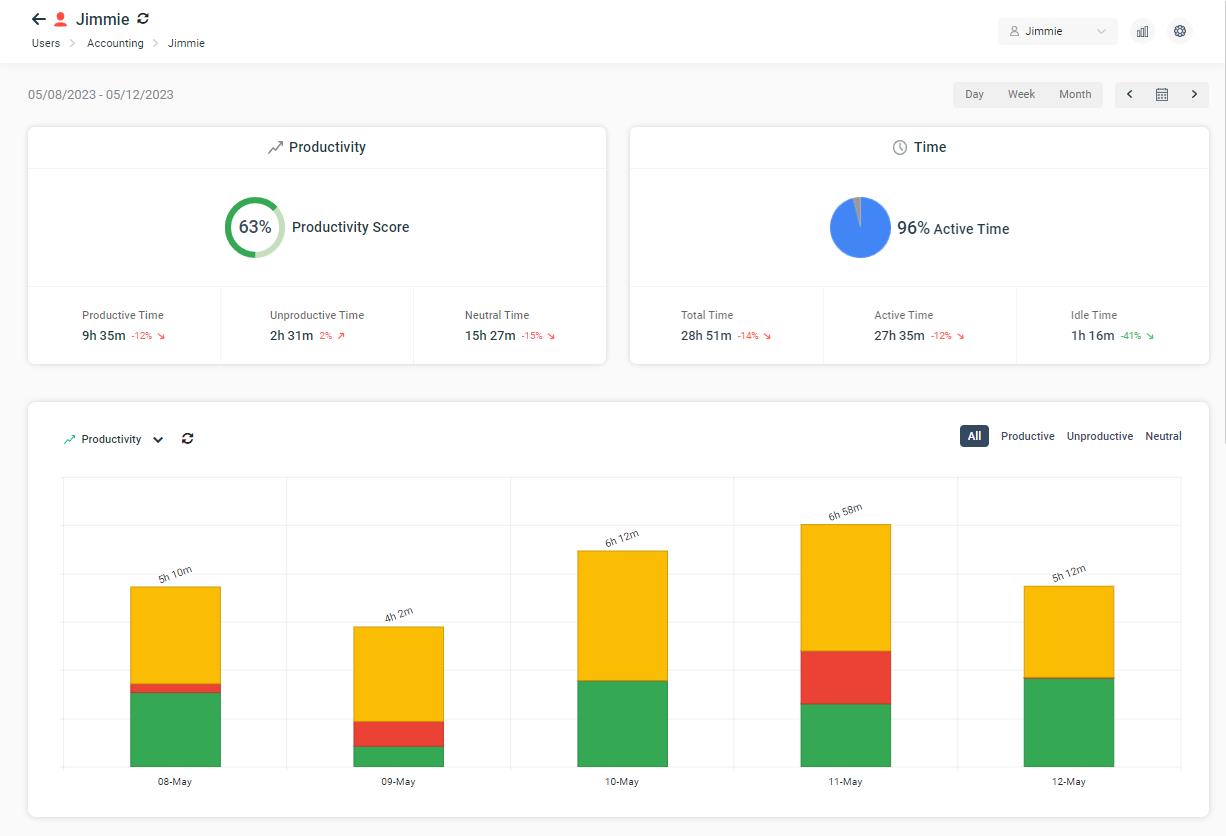
This dashboard provides detailed information about each user in your company. On the top, you can see the user’s connection status (online/offline) along with the group that they belong to. Review weekly activity to help improve user productivity and focus. View employee’s availability to see snapshots of their workday.
The application activity chart gives you a visual representation of a user’s working day/week/month. You can quickly compare the active/idle time between their work days. Pick a single day from the date picker to see their hourly spent time.
- Productivity Score & Productivity Metrics
- Active & Idle Time Metrics
- Charts
- Productivity Chart
- Active & Idle Time Chart
- Application Activity Chart
- Website Activity Chart
- Bandwidth Traffic Chart
- Activity Log – Summary (group activities by time)
- Activity Log – Detailed (minute-by-minute coverage)
Using the Dashboard
On each dashboard page, you have the option to change the selection based on the groups/users that you want to display. You can also change the date range using the date picker.
Groups/Users Selections
Choose all groups to see reports on your entire organization. Filter down to specific groups and users to gauge how your departments are performing.
The charts on the dashboards will change depending on your selection. For example, if you select groups, the Top 5 Active Time charts under the Overview will display the top 5 groups. Whereas, when you select all users, that chart will display your top 5 users.
Date Picker
Change the date to compare how your organization is performing based on your date range. Presets buttons are available for quick access to common date ranges such as today, this week and last 30 days.
Productivity scorecards automatically compare the date you picked with the previous date range.
Date range is limited to 6 months. Learn more about it in this article.
Analyzing data using the Activity Log
Each dashboard contains an activity log at the bottom of the page to give you detailed information on your organization’s activities.
- Sorting: every column is sorted. Click on the header to sort the data.
- Search: use this to narrow down the results. This is especially useful in detailed tables where you want to search for activities on specific websites or applications.
- Optional Columns: some tables contain optional columns that are hidden by default. Click on the 3 dots to reveal these optional columns.
- Export to PDF/Excel: to take your data further, you can export them in .PDF or .xlsx format to perform your own data analysis.
Dashboard Settings Menu
Located on the top right hand corner of the page, there is a gear icon (settings) that lets you configure BrowseReporter’s core features.
- Productivity Grading: change the category/website grading for your productivity scores
- More Reports: a shortcut that takes you to the legacy report window
- Exclusion List: a shortcut that takes you to the setting to exclude websites/applications from your dashboards
- Delete Data: a shortcut that takes you to the data deletion tool
- Tracking Options: a shortcut that takes you to BrowseReporter tracking options where you can enable/disable tracking, change your idle time, location track and upload frequency.
